Interactive Astronomy Diagrams
These can help you visualize the movements of the Sun, Moon and Earth!
Here are some diagrams that can help you understand more about the motions of the Sun, Moon and Earth. We've also given you a brief description of what you'll see in each one.
Most of the diagrams allow you to move slider bars to create movement of the objects in the picture. You can also spin and zoom the whole picture by using your mouse, to give yourself a better viewing angle!
Daily Movement of the Sun Through the Sky
This shows you why the Sun sets in a different place during different times of year,
and also shows you the Sun's daily path from different locations on Earth.
See the instructions for Diagram 1Collapse instructions
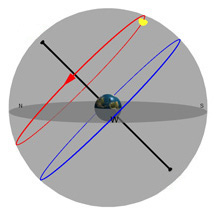
Diagram 1:
Daily Movement of the Sun Through the Sky
What you're looking at:
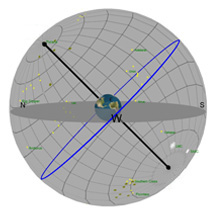
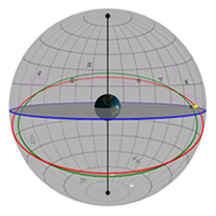
The gray flat round plate in the center of the sphere is the horizon as you'd see it if you were standing anywhere on Earth at the latitude shown by the "Latitude" slider. Basically, you can imagine yourself standing directly on top of the Earth in the middle of the sphere. We’ve added a small green “observer” to show you where that location is.
The red circle is the Sun's path through the sky on any given day (and it changes over the course of a year). The blue circle is the projection of the Earth's equator into space (and it never changes*!). The yellow ball in the sky is the Sun as it appears from Earth.
The black pole sticking through the Earth is an imaginary pole that the Earth rotates around. If we extend that imaginary pole all the way into space, it creates what we call the North Celestial Pole (NCP) in the north, and the South Celestial Pole (SCP) in the south.
*(But see the other diagrams which deal with "Precession"!)
Controls:
You can always pinch the screen or use the control at left to zoom in and out of the diagram, and your left and right mouse buttons to move and rotate the whole diagram.
Show Observer
If you check the checkbox, you’ll see a little green observer standing on top of the Earth.
The horizon we’ve drawn with the gray disk and the blue circle are the horizon this observer would see. Uncheck the box to hide the observer.
Reset Horizon
It's not always easy to get the view exactly the way you want it. Use this button to make the horizon level again!
Rotate the Earth
You can spin the Earth to put the observer right on your location. This will show you the objects in the sky exactly as they appear from where you are.
The label on this slider at the right is the observer’s longitude.
Latitude
Move this slider to your approximate latitude on Earth. The Earth will tilt when you move it.
If you "move" yourself to places like the Southern Hemisphere, the Equator, and the North or South poles, you'll see a daily movement of the Sun
that is VERY different from what you might be used to seeing in your own sky!
The Sun can't ever go outside the range of about 23.5° North to South, because that's how much the Earth tilts.
Declination
Move this slider to simulate the declination (the celestial "latitude") of the Sun. As you move it, the Sun's path through the sky will go up and down.
The Sun will be at about 23.5° North declination on June 21 each year,
and at about 23.5° South declination on December 21. It will be at about 0° on September 23 and March 20.
So what you're doing by moving this is really setting the approximate day of the year.
Sun Speed
A version of this "speed" slider is present in almost all the diagrams, and it allows you to move the objects in the diagram at varying speeds.
Click and hold the slider control, and the more you drag it to the right, the faster things will move. Release it to
have it snap back to the left and stop the motion.
This slider controls Time, and moves the Sun through the sky.
Time
Move this slider to simulate the movement of the Sun through the sky for one day. This motion is due to the rotation of the Earth. The time shown is the approximate local Solar time.
What you can learn:
- You can see why the Sun always rises and sets EXACTLY due East or West on the first days of Spring and Fall.
- You can see why the Sun sometimes never rises or never sets when you're close to either pole.
- You can see why the Sun gets so high in the sky near the equator at noon, and why it rises and sets almost always at 6:00am/pm.
- You can see why the times of Sunset and Sunrise change so much during the year if you're farther North than about 35° (or farther South than 35° South!)
- You can see why, whenever you are in the Southern Hemisphere, you have to face North to watch the Sun move across the sky - and why it looks like it's moving through the sky "backwards" from what you’d see North of the equator!
Daily Movement of the Moon Through the Sky
This shows you why the Moon is sometimes really high or really low in the sky,
and also shows you the Moon's daily path from different locations on Earth.
See the instructions for Diagram 2Collapse instructions
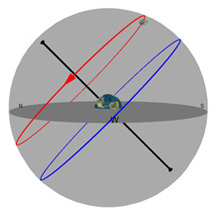
Diagram 2:
Daily Movement of the Moon Through the Sky
What you're looking at:
As in the previous Diagram, the gray flat round plate in the center of the sphere is the horizon as you'd see it if you were standing anywhere on Earth at the latitude shown by the "Latitude" slider. Basically, you can imagine yourself standing directly on top of the Earth in the middle of the sphere. We’ve added a small green “observer” to show you where that location is.
The red circle is the Moon's path through the sky on any given day (and it changes almost every day). The blue circle is the projection of the Earth's equator into space (and it never changes*!). The gray ball in the sky is the Moon.
*(But see the other diagrams which deal with "Precession"!)
If you look closely, we've made it so the Moon always shows the same face toward the Earth. This is just as it is in real life; there is one side of the Moon that we can never see from the Earth. (Please call this side the "far" side of the Moon, and not the "dark" side, because that far side gets just as much sunlight as the near side!)
Controls:
You can always pinch the screen or use the control at left to zoom in and out of the diagram, and your left and right mouse buttons to move and rotate the whole diagram.
Show Observer
If you check the checkbox, you’ll see a little green observer standing on top of the Earth.
The horizon we’ve drawn with the gray disk and the blue circle are the horizon this observer would see. Uncheck the box to hide the observer.
Reset Horizon
It's not always easy to get the view exactly the way you want it. Use this button to make the horizon level again!
Rotate the Earth
You can spin the Earth to put the observer right on your location. This will show you the objects in the sky exactly as they appear from where you are.
The label on this slider at the right is the observer’s longitude.
Latitude
Move this slider to your approximate latitude on Earth. The Earth will tilt when you move it. If you "move" yourself to places like the Southern Hemisphere, the Equator, and the North or South poles, you can simulate
the Moon's daily movement from those locations!
The Moon can go farther North and South in the sky than the Sun can, because the Moon's orbit is tilted a little more than 5° to the path the Sun takes. So when they are both at their maximum, you get a bit more than 23° for the Sun, and a bit more than 5° for the Moon - making a total of almost 29°.
Declination
Move this slider to simulate the declination (the celestial "latitude") of the Moon. As you move it, the Moon's path through the sky will go up and down. As the Moon orbits the Earth each month, its declination changes drastically. You also can't say that the Moon's declination will be any certain value
on any given day of the month - you have to calculate it or look it up in an astronomical table. You can be sure, though, that it passes through a very wide range of declinations (but never all of them) over the course of one month.
Moon Speed
A version of this "speed" slider is present in almost all the diagrams, and allows you to move the objects in the diagram at varying speeds. Click and hold the slider control, and the more you drag it to the right, the faster things will move. Release it to
have it snap back to the left and stop the motion.
This slider controls Time, and moves the Moon through the sky.
Time
Move this slider to simulate the movement of the Moon through the sky for one day.
This motion is due to the rotation of the Earth, and NOT the movement of the Moon in its orbit!
The time shown is the approximate local Solar time for the times when the Moon is full.
What you can learn:
- You can see why the Moon is sometimes really high in the sky, and sometimes really low - and this doesn't depend on its phase, or where you happen to be located on Earth!
- You can see why the Moon sometimes never rises or never sets when you're close to either pole.
- You can see why (in the Northern Hemisphere) the Moon looks like it's "leaning" on its right side as it rises, and on its left side as it sets. It's the opposite in the Southern Hemisphere.
- You can see why, whenever you are in the Southern Hemisphere, you have to face North to watch the Moon move across the sky - and why it looks like it's moving through the sky "backwards" from what you’d see North of the equator!
Phases of the Moon
Learn what causes the phases of the Moon!
See the instructions for Diagram 2aCollapse instructions
Diagram 2a:
Phases of the Moon
In this diagram, we can see exactly why the Moon appears to go through “phases” over the course of a month.
On Earth, we see the Moon move slowly through the sky from West to East over the course of a month. This movement is caused by its orbit around the Earth, and is NOT the same as its nightly East-to-West movement caused by the Earth’s rotation!
As the Moon orbits, it keeps the same half of its surface directed at Earth because of something called “tidal locking”. But since the part of it that faces the Sun continually changes, we see the result as an apparent change in the shape of the Moon itself. Because these changes are repetitive and predictable, they came to be known as “phases” – and that’s what we call them to this day.
What you're looking at:
We’ve made this diagram as simple as it can be, to show you basically how the phases work. You are positioned above either the North Pole or the South Pole of the Earth, and the Moon has been placed in a circular orbit. The Sun is far away, over at the left of the scene, and it is lighting up the half of the Earth and the Moon that face it.
You are able to control the rotation of the Earth (though that doesn’t affect the Moon phase at all), and the position of the Moon in its orbit. As you move the Moon, you’ll see that a different part of its surface is pointing toward the Sun every day. You can also see in the inset that this changes the shape of the sunlit part of the Moon that we see from Earth.
The phase we see is caused by the difference between the part of its surface we see, and the part that is being lit by the Sun.
It’s important to remember that it doesn’t matter where on Earth you are; the phase of the Moon at any given moment is essentially the same for everyone on Earth. Whether you can see the Moon or not depends on what time of day it is, though – and that’s NOT the same for everyone on Earth!
Names of the phases
It is convenient to have names for the phases, so we can talk about them. You’ll see these terms used to describe the phases, displayed in the inset box at the top left of the diagram:
New Moon
This is the “starting point” of the month, when the Moon and Sun are in the same location in the sky.
(We’ll talk about exactly what that means in a bit.) At New Moon, you’ll never be able to see the Moon – it’s too close to the Sun!
Full Moon
This is the phase everyone is familiar with, when the Moon appears to be a full circle in the sky, big and bright enough to read by.
It happens at the opposite part of the Moon’s orbit from New Moon.
The full Moon will be visible throughout the night, and will be at its highest point in the sky around midnight.
Crescent
This is a thin, rounded sliver of a Moon. It’s the typical shape used by young artists the world over whenever the Moon is
included in one of their masterpieces!
The crescent Moon is always visible just after sunset, or just before sunrise.
First or Last Quarter
Exactly half of the Moon is lit by the Sun from our perspective, and the curve separating the dark part of the Moon from
the light part (known as the “terminator” – our favorite astronomy word!) is a straight line.
The quarter Moon is visible late in the evening, or early in the morning.
Gibbous
This word is never used in common speech, and most people don’t even know it. It is the name of the oval-shaped Moon,
as it appears on either side of the Full phase.
Waxing
Used in this context, the word “wax” takes on its old literary meaning of “increase”.
It is used in combination with the phases that actually can increase: the Crescent and Gibbous phases that occur before Full Moon.
Waxing phases occur in the first half of the month, when the Moon is generally visible in the evening sky.
Waning
The word “wane” has a normal meaning of “decrease”, and that’s what the word means in the context of Moon phases.
Again, it is applied to the Crescent and Gibbous phases that occur after Full Moon.
Waning phases occur in the second half of the month, when the Moon is generally visible in the morning sky.
"Age" of the Moon
Astronomers will speak of the Moon’s “age” – sometimes in hours, and sometimes in days. A Moon that is only a few hours old
(a “young Moon”) is one that has passed the New stage only a few hours ago.
It can be a challenge to view the very thin crescent Moon that is only a few hours removed from New!
Measuring the actual point of the phases
You can look up the dates and times of the lunar phases in any almanac, and you’ll see them given to an accuracy of minutes
or even seconds of time! In our everyday life, such accuracy is not really useful, but to astronomers it can be. We need to be
able to tell exactly when the phases happen, and whenever we have a recurring action taking place, it’s nice to have a point
that everyone agrees to “start the clock” from!
It seems like this should be easy: Just figure out when the Moon and the Sun are at the same place in the sky, and that’s the point of New Moon. Simple, right? Well, it’s not that easy. Take a look at this diagram, which is greatly exaggerated but shows the point:

In this drawing, three people are observing the Moon from different locations on Earth. Each of them will see the Moon located “in the same place as the Sun” at different times, as the Moon moves through its orbit.
That’s right – the Moon is close enough to the Earth that people on different parts of the Earth will see the Moon and the Sun being “in the same place” at slightly different times!
The name for this effect is “parallax”, and we will devote an entire diagram to that concept.
To complicate things even more, remember that the Earth (carrying the observers with it) is rotating while we wait for the Moon to hurry up and line up with the Sun for our different observers. This makes it even more complicated to try and figure out what we would mean by defining things using the individual observers' viewpoints.
And remember, we’ve also simplified the diagram a great deal by flattening the Earth so we can neglect the effects of observers located at different latitudes!
The solution to all this complication is to avoid making things dependent on where the observer is located. Astronomers therefore determine the time of New Moon to be when the the Sun and the Moon are “lined up”, as we would see them from the point of view of the CENTER of the Earth.
As with everything else in astronomy, there are fancy words to describe this, and you might as well learn them now:
- Geocentric observations mean that you are viewing from the center of the Earth. (Of course, you can’t really do that, but it’s a great location to use for the math. Besides, everyone can agree on where it is!) The word means “earth-centered”.
- Topocentric observations mean that you are viewing from wherever you are located. It’s reasonably straightforward to convert any geocentric times of observation to topocentric, and that’s what astronomers do. (You have to know the latitude and longitude of the observer, of course.) This word means “place-centered”.
Oh, and we forgot to tell you what it means for the Moon and Sun to appear to be “in the same place” in the sky. Since eclipses don’t happen every month (for reasons we’ll explore in a future diagram), we have to define what we mean by the Sun and the Moon being “lined up”, as we called it. That way, we can all agree to start the New Moon clock at the same instant of time.
To do this, we could use several different methods. We could use the time that the Moon and Sun are at the same height above the ground (altitude), or at the same distance around the horizon (azimuth). We could also use the time that the Sun and Moon are as close together as they will get for that month (their “angular separation” is smallest). The problem with these observations is that they are different for different observers, so we have to use a geocentric definition – one that doesn’t depend on where the observer is located.
We could use the time that the Moon and Sun have the same apparent “longitude” in the sky, and we have a term for that “longitude” – we call it “Right Ascension”. (We’ll learn about that in another diagram.) It’s not a bad idea, but Right Ascension is measured using the Earth’s Equator as a reference, and that measure changes its orientation as the Earth moves around the Sun during the year.
The best measure to use is one that defines a different kind of “longitude” by using the Sun’s apparent path through the sky over the course of a year. That path doesn’t change much at all over the course of a human lifetime, so it’s convenient to use for calculations that have to be compared over long spans of time. That path is called the “ecliptic”, and the measurement we need is called the Celestial Longitude (to distinguish it from the “Equatorial Longitude”, or Right Ascension). These definitions mean that we can say the Sun and Moon are in the same place in the sky – and therefore, that the point of New Moon occurs – at the moment when they have the same geocentric celestial longitude.
And now you know!
Once we have the time of New Moon established, then we can simply use standard hours or days to run the Moon’s “age clock” through the rest of the phases until it’s time for New Moon again. But remember: it’ll be close to 28 days, but not exactly!
Controls:
Day of the Month
This control moves the Moon around the Earth over the course of one month. It’s important to remember that
the Moon will be orbiting in the correct direction ONLY when you move the control from left to right!
Speed
This control moves the Moon around the Earth in the correct direction of its orbit, over the course of
many days.
View from Southern/Northern Hemisphere
This button allows you to move yourself from whichever pole you’re viewing from, to a point directly above
the other pole. It’s important to note that, if you’ve lived most or all of your life in one of these
hemispheres, you’ll see the Moon do the following things if you travel to the other hemisphere:
- It will appear “upside down” in the sky
- It will appear to move the “wrong way” through the sky during the month
- It will appear to move the “wrong way” through the sky during a single night
- The phases will appear to be on the “wrong side” of the Moon
- You will need to face a different direction to see the Moon in the sky
These are all to be expected, because you’ve moved yourself to a part of the Earth that gives a completely different view of the Moon. (And by the way, the Sun and stars will do exactly the same things!)
When are the phases visible?
If you set the Moon at a certain phase (by moving it around the Earth until it shows that phase), you’ll see that exactly one
half of the Earth is pointed toward it. For example, if you place the Moon at first quarter, you’ll see that the terminator of
the Earth – the line that divides daytime from nighttime – is pointed directly at the Moon. If you rotate the Earth, you’ll see
that that part of the Earth (along the terminator) is experiencing sunset.
What this means for that phase is that no matter where you are on Earth, the First Quarter Moon will be visible to you any time you are in that region of Earth that goes from about noon, through sunset, to about midnight. And this is what we find in real life: the First Quarter Moon is generally high in the sky around sunset.
For the Full Moon, you’ll find it’s high in the night sky around midnight. For Last Quarter, around sunrise. And for the New Moon, it’s high in the sky around noon each day. That’s why you can never see it; the Sun is up as well, high in the sky at noon. It’s right in the same place in the sky as the New Moon, and the Sun is so bright that it drowns the Moon out completely.
Simplifications in our diagram
We’ve neglected items that don’t change the definitions of our terms, but would be very important to consider if we wanted to
make accurate calculations. We’ve ignored the fact that the Moon’s orbit isn’t a perfect circle, and that the Moon “wobbles” as it
orbits (so the part of it that we see facing us changes very slightly). We’ve ignored the angle the Moon’s orbit makes with the
Sun’s apparent path through the sky, and we’ve set the orbit at exactly 28 days when it’s really not. (In fact, there are no fewer
than FIVE different ways to define a “month” in astronomy. They’re all slightly different, they’re all very close to 28 days,
and none of the differences matter at all if we’re just trying to learn the lunar phases!)
Something Extra
There are two calendars in common use around the world whose months are based on the movements of the Moon. These calendars,
not surprisingly, are known as “lunar” calendars. The Islamic calendar defines the beginning of each month as the time of sighting
of the very young Crescent Moon. In ancient times, the Hebrew calendar used the same definition, though over time the actual
observation has been replaced by the use of mathematical calculations.
A thorough study of these two calendars is well beyond the scope of our diagrams. The calendars are very complicated, and learning about them in detail will be an extensive but very worthy effort, if you choose to do so!
What you can learn:
- You can see why the bright part of the Moon appears to change shape during the month.
- You can learn why the various phases of the Moon are visible only at certain times of night.
- You can learn some new astronomy terms, like Gibbous, Geocentric, Topocentric, and Terminator.
- You can see that the Moon’s appearance and position change slightly as seen from different locations on Earth.
- You can learn that the same side of the Moon always faces the Earth.
- You can learn what the “age” of the Moon means.
- You can learn that there are other calendars in use in the world.
- You can learn why we have a need to define coordinates in the sky in several different ways.
- You can see that we always have to simplify certain things in astronomy, in order to show other things easily.
Daily Movement of One Star Through the Sky
This shows you the different types of daily motion for a star anywhere in the sky, from any location on Earth.
See the instructions for Diagram 3Collapse instructions
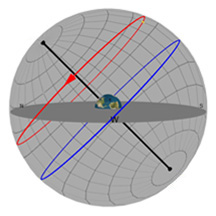
Diagram 3:
Daily Movement of One Star Through the Sky
What you're looking at:
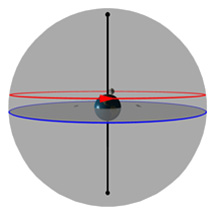
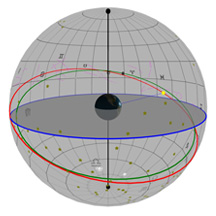
As in the previous diagrams, the gray flat round plate in the center of the sphere is the horizon as you'd see it if you were standing anywhere on Earth at the latitude shown by the "Latitude" slider. Basically, you can imagine yourself standing directly on top of the Earth in the middle of the sphere. We’ve added a small green “observer” to show you where that location is.
We've given you your very own star! You see one single star placed up there in the sky, and you can change its location to be wherever you want.
We've also placed a coordinate grid in the sky, kind of like lines of latitude and longitude that you'd see on Earth. Astronomers use a similar coordinate system to describe positions in the sky, but up here, latitude is called "Declination" (or "Dec" for short) and longitude is called "Right Ascension" (or just good old "RA" for short). Every object in the sky has a Dec and an RA, and for the stars, that location doesn't change enough for you to ever notice it.
We've made it so you can put your star anywhere you like in the sky by changing its Declination and RA - just move the sliders!
The blue circle is the projection of the Earth's equator into space. The red circle is your stars's path through the sky on any given day. Once you've set the position of your star, you'll see that its path never changes over the course of a year.
Controls:
You can always pinch the screen or use the control at left to zoom in and out of the diagram, and your left and right mouse buttons to move and rotate the whole diagram.
Show Observer
If you check the checkbox, you’ll see a little green observer standing on top of the Earth.
The horizon we’ve drawn with the gray disk and the blue circle are the horizon this observer would see. Uncheck the box to hide the observer.
Reset Horizon
It's not always easy to get the view exactly the way you want it. Use this button to make the horizon level again!
Rotate the Earth
You can spin the Earth to put the observer right on your location. This will show you the objects in the sky exactly as they appear from where you are.
The label on this slider at the right is the observer’s longitude.
Latitude
Move this slider to your approximate latitude on Earth. The Earth will tilt when you move it. If you "move" yourself to places like the Southern Hemisphere, the Equator, and the North or South poles, you'll see how the daily movement of your star changes!
Declination
Unlike the Sun and the Moon, stars can be located at any place in the sky. There are stars that are really far north, stars that are near the equator, stars that are far south, and stars everywhere in between! We see them wherever they are, because that's
how the Earth and all the stars near the Earth just happen to line up at this particular time in history. You can put your star anywhere you like by using this control!
Why did we say "near the Earth"? Well, most people know that our Solar System is part of the galaxy we call the "Milky Way". But most people don't know that each and every one of the stars you see in the night sky is not only within our own galaxy, but is at a distance that is less than halfway to the center of our galaxy! Put another way - EVERY STAR that you see in the sky is closer to Earth than the center of our galaxy by a VERY wide margin. And you can forget about seeing stars that are on the other side of the galaxy! Even in the darkest sky, the farthest stars you can possibly see individually (under perfect conditions) are less than 17,000 light years away. Almost all the stars we see are much, MUCH closer than that. And the center of our galaxy is about 25,000 light years away! So yes, all the stars you can see are indeed - as far as the galaxy is concerned - very "near" to us!
If you put the star at a high enough declination, and you set a latitude in the Northern Hemisphere, then you'll see that your star never sets! (Remember, the flat gray plate is your local horizon.) If you set the star's declination far enough south, and set a latitude in the Southern Hemisphere, then you'll see that once again, the star will never set! These stars are called "circumpolar", because they just circle the pole and don't rise or set.
If you put your star high enough in the north, and then put yourself far enough south, you'll see that it's possible for you never to be able to see the star at all! That's why, at this particular time in history, that Canada will never be able to see the Southern Cross!
If you're on the equator, you can see basically every star in the sky at some point during the day. Well, you could, if the really bright Sun weren't also in the sky!
Play with it a bit, moving the star and yourself around. Then move the time around so you can see the star rise and set, and move through the sky. This will give you a good background for what comes next.
RA
This one is a little trickier to explain. At first glance, it looks like it doesn't matter where you put the star from "right to left", because once you change the time of day using the time slider, the star will go across the sky pretty much in the same way as any other
star at that declination.
But if you look closely, you'll see that it DOES matter where you put it! Obviously, not all the stars are at the same RA in the real sky, and that's why some of them are high in the sky at the same time as others are rising, and others are setting.
If you put your star at an RA that makes it look like it's rising at, say, 6:00am, then someone else might put their star at an RA that makes it look like it's setting at 6:00am! There are stars at every RA you can imagine, so at every instant of the day
there are stars that are rising and setting - even in the daytime!
The stars are always there in the sky - we just can't see them during the day because the Sun is too bright. But they are definitely there!
So how do you know where to place your star? For now, it's enough to know that you can put it at any RA you want, and we'll talk more about RA in later diagrams. You should use this diagram more to see how stars at different declinations move across the sky differently.
Star Speed
A version of this "speed" slider is present in almost all the diagrams, and allows you to move the objects in the diagram at varying speeds. Click and hold the slider control, and the more you drag it to the right, the faster things will move. Release it to
have it snap back to the left and stop the motion.
This slider controls Time, and moves the star and the RA/Dec grid through the sky.
Time
Move this slider to simulate the movement of the star through the sky for one day. Remember that this movement, like that of the Moon and Sun in the previous diagrams,
is due to the rotation of the Earth - and not any movement of the star itself! And also, the time we're showing doesn't have much meaning in this simple context - but more about that later!
What you can learn:
- You can see why some stars are always visible from some latitudes.
- You can see why some stars are never visible from some latitudes.
- You can see why the stars appear to circle the poles in both hemispheres.
- You can see why the stars move counterclockwise around the North Pole (NCP), and clockwise around the South Pole (SCP).
- You can see why, similarly, the stars appear to move from "left to right" as you face south in the Northern Hemisphere, and from "right to left" as you face north in the Southern Hemisphere.
Daily Movement of Lots of Stars Through the Sky
Now we're showing some of the more famous stars, constellations and other objects,
and you can see how they move over the course of a day.
See the instructions for Diagram 4Collapse instructions
Diagram 4:
Daily Movement of Lots of Stars Through the Sky
What you're looking at:
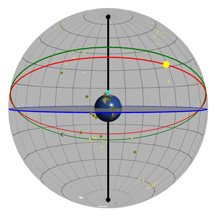
Yet again, the gray flat round plate in the center of the sphere is the horizon as you'd see it if you were standing anywhere on Earth at the latitude shown by the "Latitude" slider. Basically, you could imagine yourself standing directly on top of the Earth in the middle. We’ve added a small green “observer” to show you where that location is.
We still have the blue circle, which is the projection of the Earth's equator into space. But now, we've added a whole lot of stars, constellations, and a couple of other objects - and we've put them where they really go in the sky, based on their RA and Dec coordinates. This time, you're not going to be allowed to change the stars' coordinates, because they're set.
It's probably a good time to note that all of the lines of RA and Dec that we've put in the sky are 15° apart. That seemed like a good number for Dec, because we don't have too many or too few lines there to cover the entire range from -90° to +90°. But also, it matches the number we really want to use for our grid separations in RA. You see, on Earth we talk about "degrees" for both latitude and longitude. But in the sky, we don't use degrees for RA! It's more convenient to use hours (we'll tell you why in just a minute), and the conversion just happens to be that 1h of RA equals 15° of arc. (Why is that? Well, the stars make one loop of 360° around the sky in one day, which is 24 hours - and 360° divided by 24 is 15°)!
You might have just guessed what our explanation was going to be, then: We use "hours" for RA because an hour of RA is how far a star appears to move through the sky in the course of one hour of clock time!
Measuring Distances in the Sky
This discussion about “degrees” in the sky gives us a chance to discuss something very important – how do we measure the distances between objects in the sky?
We can’t just hold up a ruler and say that two stars are so many inches or centimeters apart! Astronomers use degrees, just like the degrees you learn about in school,
where a complete circle has 360° in its circumference. If you draw a stricht line in the sky from one point on the horizon, through the point straight overhead, to the opposite point on the horizon,
that’s 180° of arc. From the horizon to straight overhead is 90°.
Controls:
You can always pinch the screen or use the control at left to zoom in and out of the diagram, and your left and right mouse buttons to move and rotate the whole diagram.
Show Observer
If you check the checkbox, you’ll see a little green observer standing on top of the Earth.
The horizon we’ve drawn with the gray disk and the blue circle are the horizon this observer would see. Uncheck the box to hide the observer.
Reset Horizon
It's not always easy to get the view exactly the way you want it. Use this button to get the horizon level again!
Rotate the Earth
You can spin the Earth to put the observer right on your location. This will show you the objects in the sky exactly as they appear from where you are.
The label on this slider at the right is the observer’s longitude.
Latitude
Again, move this slider to your approximate latitude on Earth. The Earth will tilt when you move it. If you "move" yourself to places like the Southern Hemisphere, the Equator, and the North or South poles, you'll see how the daily
movement of the stars through the sky is VERY different from what you might be used to seeing in your own sky!
Sky Speed
A version of this "speed" slider is present in almost all the diagrams, and allows you to move the objects in the diagram at varying speeds. Click and hold the slider control, and the more you drag it to the right, the faster things will move. Release it to
have it snap back to the left and stop the motion.
You will still be able to see Northern and Southern circumpolar stars by positioning yourself correctly. You can't change where the stars are in the sky, but you can visualize yourself at a different latitude on Earth!
This slider controls Sidereal Time, and moves the stars and the RA/Dec grid through the sky.
Sidereal Time
Move this slider to simulate the movement of the Sun through the sky for one day. The time shown is what is known as "Sidereal" time, and we need to explain what that is:
First, a definition: We say that an object "culminates" when it reaches its highest point in the sky. This is generally the time when it touches the imaginary line that goes from due north, then through the highest point in the sky (called the "Zenith") and then ends at the due South point. For circumpolar objects, they can hit this line twice during one day, and so we talk about their culmination point being when they hit that imaginary North-South line above the pole. For practical purposes, think of the Sun at local solar noon. It's as high at that moment as it's ever going to get during that day.
Because of the motion of the Earth around the Sun, it takes just a little bit longer each day for the Sun to get to its culmination point than it does for the stars to do the same thing. How long? Just a bit less than 4 minutes. That doesn't sound like much, but it adds up. Over the course of a year, it amounts to a full 24 hours!
A long time ago, people used the Sun to tell time. This gave us a "solar" day, and it's what our time system is generally based off. But in astronomy, we like to think about time relative to the stars, and that means we have to account for this 4-minute difference. We do that by making up a time system that is based on the stars rather than the Sun, and we call that system "Sidereal Time".
You won't be able to find any clocks that keep sidereal time at your local store (though you can buy them online, and there are lots of apps that will show you a sidereal clock on your mobile device). But there is one place you can always look to find the current sidereal time: the stars!
The way astronomers set things up, it works out that if you take note of whatever star is culminating at the moment (that is, it is exactly due south in the Northern Hemisphere, or due north in the Southern Hemisphere), and find its RA, then that will be the current sidereal time!
Let's take the star Antares as an example. In the diagram, set your latitude in the Northern Hemisphere (say, 30°N), then rotate the diagram to position yourself above the north pole of the Earth. The black pole of the Earth should be straight up and down on the screen. Now set the "Sidereal Time" slider to 16:30, and notice how the star Antares is exactly due South. As it happens, Antares' RA is 16h 30m (within about 35s of arc!), and so Antares will reach that exact spot in the sky every day at 16:30 Sidereal Time - like clockwork. You could set your watch by it - IF we lived in a world where everyone used sidereal time!
Note that this will almost never be exactly 16:30 local time, because of the 4 minute daily shift that happens between Solar time and Sidereal Time. In fact, those two times will only match on (or within a day of) September 23 each year. Other Sidereal Time values will match their solar time counterparts on different days. We'll learn more about this (and quite a bit more) in the next diagram. You can also go to Diagram 15 to learn more about the difference between Sidereal and Solar days.
What you can learn:
- You can get a simple introduction to Sidereal Time.
- You can see how each star has a set RA, and how this RA matches the Sideral Time of the star's culmination.
- You can learn how distances between objects in the sky are measured in degrees.

More About Sidereal Time
This shows you the relationship between Sidereal Time, Solar Time and the day of the year.
See the instructions for Diagram 5Collapse instructions
Diagram 5:
More About Sidereal Time
What you're looking at:
Diagram 5 is the same as Diagram 4; we've just added some more controls.
Controls:
You can always pinch the screen or use the control at left to zoom in and out of the diagram, and your left and right mouse buttons to move and rotate the whole diagram.
Show Observer
If you check the checkbox, you’ll see a little green observer standing on top of the Earth.
The horizon we’ve drawn with the gray disk and the blue circle are the horizon this observer would see. Uncheck the box to hide the observer.
Reset Horizon
It's not always easy to get the view exactly the way you want it. Use this button to get the horizon level again!
Rotate the Earth
You can spin the Earth to put the observer right on your location. This will show you the objects in the sky exactly as they appear from where you are.
The label on this slider at the right is the observer’s longitude.
Latitude
Again, move this slider to your approximate latitude on Earth. The Earth will tilt when you move it. If you "move" yourself to places like the Southern Hemisphere, the Equator, and the North or South poles, you'll see how the daily
movement of the stars through the sky is VERY different from what you might be used to seeing!
Local Time Speed
A version of this "speed" slider is present in almost all the diagrams, and allows you to move the objects in the diagram at varying speeds. Click and hold the slider control, and the more you drag it to the right, the faster things will move. Release it to
have it snap back to the left and stop the motion.
This slider controls local time, and moves the stars and the RA/Dec grid through the sky.
Local Time
This slider shows the approximate Solar Time at the "top" of the Earth in the middle of the diagram. "Top" means the point on the little Earth that is farthest away from the gray horizon circle.
Day of Year Speed
A version of this "speed" slider is present in almost all the diagrams, and allows you to move the objects in the diagram at varying speeds. Click and hold the slider control, and the more you drag it to the right, the faster things will move. Release it to
have it snap back to the left and stop the motion.
This slider controls the Day of the Year, and moves the stars and the RA/Dec grid through the sky.
Day of the Year
Move this slider to change the day of the year.
Important notes on the sliders for Diagram 5
What will happen as you change the local time or the day of the year, is that the entire sky will revolve. The Sidereal Time slider (at the bottom) will then show the local Sidereal Time at the point on "top"
of the Earth where you're located. This lets you see how different stars culminate at different times of the Solar day, but at the same time when measured by Sidereal Time.
Once again using Antares as an example, you can see that if you set the Day as January 1, then you have to move the Local time slider to 10:15am to get the Sidereal Time slider to read 16:30. And at that time, you'll see that Antares is indeed culminating - in the middle of the day! If you set the day to be July 30, then Antares will culminate at 8:15pm.
If you set the date as June 1, then Antares will culminate at midnight. The date of June 1 is therefore said to be the date of "midnight culmination" for Antares, and this is a fact you'll be able to look up for each star. It's nice to know the date of midnight culmination for an object, because you'll then know what day of the year it'll be highest in the sky at midnight. If you are observing before that date, then the star will culminate later than midnight, and if you're observing after that date, it will culminate before midnight. This can help you plan your observing activites (and your sleep schedule!) for the part of the night that suits you.
(How much earlier or later than midnight will the object culminate? About two hours for each month you are before or after the midnight culmination date. After all, 360° around the sky in 12 months is 30° per month, and that's the same as 2 hours of RA!)
Sidereal Time
This slider shows the Sidereal Time for that same "top" point on Earth where your little green observer is located.
As we've said, you are not able to move this slider, because it is linked to the values you set on the other ones.
What you can learn:
- You can see the relationship between local solar time, local sidereal time, and the day of the year.
- You can learn what an object's "midnight culmination date" means.
- You can see how to use any celestial object's RA, as well as a sidereal clock app, to learn when the object will be at its highest point in the sky.
- You can see how none of this is dependent on your latitude, or even your hemisphere! When celestial objects culminate, they are at that moment as high in the local sky as they will ever be. And what's more, they provide a perfect timekeeping mechanism that will never fail you - OR run out of battery!
Constellations of the Ecliptic (Zodiac)
Here, we'll give an explanation of the "Ecliptic" -
the imaginary path that the Sun takes through the sky over the course of a year.
See the instructions for Diagram 6Collapse instructions
Diagram 6:
Constellations of the Ecliptic (Zodiac)
What you're looking at:
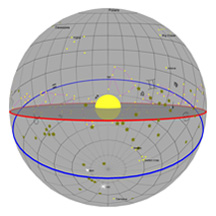
We've put the Sun at the center of the diagram this time, and there is a little Earth that is orbiting around it. This is the way it is in real life!
The blue circle is once again the celestial equator.
The gray flat round plate in the center of the sphere is what we will call the orbital plane of the Earth. Over the course of a human lifetime, it is pretty much fixed from year to year, as far as we're concerned. (Though that is not true if you consider several thousand years of time! See diagram 7 for a more thorough explanation of this!)
The red circle is the Sun's apparent path through the sky over the course of a year - called the "Ecliptic". You'll notice that the red and blue circles are inclined to each other by about 23.5°. This is the angle of Earth's tilt on its axis.
You'll also notice that the red and blue circles intersect at two places: in the constellations of Pisces and Virgo. (You may need to look up the constellation symbols we've used, if you're not familiar with the star patterns of the constellations.)
Controls:
You can always pinch the screen or use the control at left to zoom in and out of the diagram, and your left and right mouse buttons to move and rotate the whole diagram.
Reset Orbit
This button will get the red circle (Earth's orbital plane) back to level.
Reset Equator
This button will get the blue circle (the celestial equator) back to level.
Day of the Year Speed
A version of this "speed" slider is present in almost all the diagrams, and allows you to move the objects in the diagram at varying speeds. Click and hold the slider control, and the more you drag it to the right, the faster things will move. Release it to
have it snap back to the left and stop the motion.
This slider controls the Day of the Year, and moves the Earth around the Sun.
Day of the Year
There's really only one control that we can use here - but it's REALLY important! Use this slider to set the day of the year, and then if you sight along the line that connects the Earth to the Sun, you'll see what constellation the Sun
appears to be in on that date. You wouldn't be able to see any stars in that constellation in the real sky, because the Sun is so bright that it creates this thing we call "Day"!
There is a lot to cover here, so let's take things one at a time. To begin, you'll notice that the leftmost slider setting for the "Day of the Year" is March 21. There's a reason that we chose the first day of Northern Hemisphere Spring to start the year with: If you check out the line from the Earth to the Sun, you'll see that the Sun appears to be in the sky at one of those points where the ecliptic meets the equator. This point is very important, because we had to choose some date to "begin" the astronomical year with. This point, when the Sun's declination in the sky is 0°, seems to be as good as any. But why is that?
If you move the slider to a day or two later than Mar 21, you'll see that the Sun's declination is moving upward through the stars. This means that it's getting higher in the sky, and Summer is therefore approaching. The first day of Spring (also called the "Vernal Equinox") seems like a really convenient day to start our year on. And by the way, the term "vernal equinox" comes from two sources - "Vernal" from "ver", which is Latin for "Spring" - and "equinox" from "equal-night". Remember from Diagram 1 that on this day the Sun rises and sets at 6:00/18:00 - so that the day and night are equally long. (This also happens on the first day of Autumn, and so we call that date the "Autumnal Equinox".)
Astronomers went one step further with this Vernal Equinox point. Remember how RA is kind of like "longitude" in the sky? Well, on Earth they needed to decide on one particular point to mark as the 0° line of longitude. Astronomers simply agreed to use the Greenwich Observatory in England, and so that's the place we use to begin our measurement of longitude on Earth. A similar point was needed in the sky, to define the 0h mark for RA, and you guessed it - the Vernal Equinox point was chosen.
Astronomers also call this point the "First Point of Aries", even though the point is most definitely located in the constellation of Pisces! But a long time ago (a couple of thousand years), when things like this were being considered by the ancient Greek astronomers, this point was indeed located in the constellation of Aries. It has moved since then (!), because of an effect called "precession", which is a bit outside the scope of this diagram (but see diagram 11!). Precession causes the entire orbit of the Earth to move like a top which is wobbling as it winds down. This precession effect causes the whole ecliptic to rotate very slowly through space. We'd recommend you visit Digrams 11 and 12 to learn more about this, because there are some really interesting things that happen due to precession: For example, Northern Hemisphere Summer coming in December in about 12,000 years, and Polaris no longer being the "pole star" just a couple thousand years from now. (And don't forget about the great pyramids in Egypt being perfectly aligned to true north - as it was 5,000 years ago!)
If you're familiar with Astrology, you'll know that Aries is also the first sign of the Zodiac - just like that "First Point of Aries" concept from Astronomy. The Sun is actually nowadays in the constellation of Pisces during the traditional astrological dates of "Aries", and that mismatch happens for exactly the same reason - the precession that has taken place since the astrological definitions were put in place so many centuries ago.
But back to the present day: Notice that at some times of year, the Sun has a high declination. As we saw in Diagram 1, this means the Sun is high in the sky for the Northern Hemisphere, and so the rays of the Sun are much more perpendicular to the ground at this time. Without going into a lot of math, this is why Summer in the Northern Hemisphere happens during the months that it does. A similar thing happens in the North's winter months; during this time, the Sun's declination is negative, and so it is high in the sky for folks in the Southern Hemisphere - giving them their Summer during December and January.
Since the change in the Sun's declination is caused by the angle between the equatorial and ecliptic planes, and that is caused by the tilt of the Earth's rotational axis, then we can confidently say that the reason we have any seasons at all is because of the tilt of the Earth! The change in seasons has nothing to do with whether the Earth is closer to or farther away from the Sun; in fact, the Northern Hemisphere Summer happens during the time of year when the Earth is actually a little farther away from the Sun than it is in Winter! This double whammy makes folks in the Southern Hemisphere experience a slightly warmer Summer than in the North. The fact that there is more water area in the Earth's Southern Hemisphere helps to offset that a bit, but now we're getting well outside the realm of astronomy!
Over the course of a year, the Sun appears to move through 12 particular constellations. These are known as the constellations of the Zodiac. The word "zodiac" comes from the same root as "zoo", meaning animals. Only 7 of the 12 constellations represent animals, but that seems to have been a good enough percentage to justify the name.
And while we're at it, we've also included the historically ignored constellation of Ophiucus in the mix. There is a period of about 18 days in early December when the Sun actually appears to lie within the boundaries of Ophiucus. Apparently, when folks long ago were sitting around trying to figure these things out, the fact that including Ophiucus would give us 13 Zodiac signs for only 12 months outweighed the fact that the constellation itself represents a dude holding a very "zoological" snake. Sadly, this exclusion means you won't find any horoscopes nowadays for persons born under "Ophiucus" - though if your birthday is in the first half of December, now you know why all the Sagittarius stuff might not always seem to fit!
What you can learn:
- You can see what constellation the Sun is in for any day of the year.
- You can see what the "Zodiac" is, and how it relates to the astronomical term "Ecliptic".
- You can see how the Sun changes its declination over the course of a year, causing the seasons.
- You can see why some stars are not visible in the sky during certain times of year - because they're too close to the Sun!
The Ecliptic (Earth-centered view)
We've re-drawn diagram 6 to show the Sun's path through the Zodiac more clearly.
See the instructions for Diagram 7Collapse instructions
Diagram 7:
The Ecliptic (Earth-centered view)
What you're looking at:
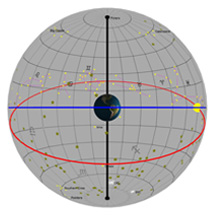
This is basically the same diagram as Diagram 6; we've just put the Earth at center of things, and placed the Sun in the Sky the way it appears from Earth. The Zodiac, the ecliptic and the equator are all the same as before.
Controls:
You can always pinch the screen or use the control at left to zoom in and out of the diagram, and your left and right mouse buttons to move and rotate the whole diagram.
Reset Orbit
This button will get the red circle (Earth's orbital plane) back to level.
Reset Equator
This button will get the blue circle (celestial equator) back to level.
Rotate the Earth
We've given you this control because it's nice to be able to see how the Sun shines on the Earth at different times of the day. There's nothing much more to it than that.
Day of the Year
This slider does the same thing it did in Diagram 6, but now with the Sun "moving" through the constellations, it's much easier to see where the Sun is located in the sky. Even though we know this
Earth-centered view isn't astronomically correct, it still helps to be able to imagine it this way - because it reflects what we actually see from here on Earth!
Day of the Year Speed
A version of this "speed" slider is present in almost all the diagrams, and allows you to move the objects in the diagram at varying speeds. Click and hold the slider control, and the more you drag it to the right, the faster things will move. Release it to
have it snap back to the left and stop the motion.
This slider controls the Day of the Year, and moves the Sun through the ecliptic while it spins the Earth.
What you can learn:
- Basically, the same things you saw in Diagram 6...but easier to visualize!
- Don't be fooled by the simplicity - this apparent yearly "motion" of the Sun through the Zodiac is a VERY important astronomical concept.
Introduction to Eclipses
A very simple diagram to show you how the Moon's movement
around the Earth can lead to solar and lunar eclipses.
See the instructions for Diagram 8Collapse instructions
Diagram 8:
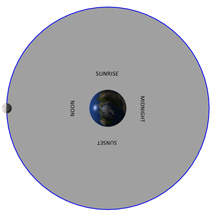
Introduction to Eclipses
What you're looking at:
We have flattened the orbit of the Moon around the Earth, and the gray horizon circle in the center of the sphere is parallel to that orbit. You can move the Moon up and down in declination, and you can move the Moon around the Earth. (The Sun's direction is fixed.)
We've also added an inset view of the Moon as seen from Earth, so you can watch the Moon's phase change as it moves in its monthly orbital path.
Controls:
You can always pinch the screen or use the control at left to zoom in and out of the diagram, and your left and right mouse buttons to move and rotate the whole diagram.
Reset Horizon
It's not always easy to get the view exactly the way you want it. Use this button to get the horizon level again!
Declination
Move this slider to move the Moon up and down. As the Moon goes around the Earth each month, its declination changes. Here, things are simplified so much that the real use of this control is to be able to move the Moon
up or down far enough that you can move in or out of an eclipse situation. If you move the Moon toward a 0° declination, then you'll be able to see its shadow on the Earth at New Moon, and the Earth's shadow on it at Full Moon - just like
the way real eclipses happen! Please note that we've set the Sun's declination at 0° for this diagram; the Moon is the only thing that is moving!
In the next diagram we'll show how the Moon also changes declination as it moves around the Earth.
Of course, eclipses don't happen as often as this diagram would have you believe. We'll expand on this picture greatly in the next diagram, but for now just notice how the position of the Moon in its orbit can either prevent or cause eclipses. The Moon's declination at the time it might be capable of causing an eclipse - or being eclipsed itself - is extremely critical!
Day of the Month
Move this slider to move the Moon around the Earth and see the phases.
Day of the Month Speed
A version of this "speed" slider is present in almost all the diagrams, and allows you to move the objects in the diagram at varying speeds. Click and hold the slider control, and the more you drag it to the right, the faster things will move. Release it to
have it snap back to the left and stop the motion.
This slider controls the Day of the Month.
Rotate the Earth
Again, you can rotate the Earth to simulate the Sun shining on different parts of it as the day progresses.
What you can learn:
- You can see what causes the phases of the Moon.
- You can see a very simple model of why eclipses happen.
The Paths of the Sun and Moon through the Zodiac
A more realistic view of the motion of the Sun and Moon -
showing you much more about eclipses!
See the instructions for Diagram 9Collapse instructions
Diagram 9:
The paths of the Sun and Moon through the Zodiac
What you're looking at:
Now things are getting interesting! We've brought the constellations back (but for clarity, we've removed the stars for now), and placed the orbits of the Sun (red circle) and Moon (green circle) over them. Everything is Earth-centered, and once again the blue circle is its equatorial plane.
The red path of the Sun is called the "Ecliptic", and that is inclined 23.4° to the Earth's equator due to the Earth's axial tilt. This is more exact than in previous diagrams, because now we need that bit of extra accuracy.
We've added the Moon's orbital path in green, and that is inclined 5.1° to the ecliptic. This makes it about as accurate as we can show on a diagram like this. We've chosen the first point of Aries to have those two orbits intersect, but in truth that point of intersection changes gradually over time (more about that later!)
There is a new symbol we've placed at the first point of Aries. When the diagram loads, at that point the Sun and Moon are at the same declination (0°), and their paths intersect. As time moves on, the Moon moves above the ecliptic. Two weeks later, on the other side of the sky, you'll see that the orbits intersect again - and this time, as we move forward in time the Moon moves below the ecliptic. We are going to call these two points in the Moon's orbit its "Ascending Node" and "Descending Node", respectively.
"Node" is because the two orbits are intersecting, and this is the traditional name given to the important points in all kinds of different network maps. "Ascending" and "Descending" are because the Moon is moving "up" over the ecliptic, or "down" below the ecliptic at those two respective points. That little symbol that looks like a horseshoe with circles on the ends is pointed up (open end down) at the ascending node, and vice versa at the descending node.
Movement of the Nodes
These nodes move! That's right, astronomers long ago determined that the "line of nodes" (the imaginary line through the Earth that connects the two nodes) is moving very slowly, in the opposite direction that the Sun and Moon appear to move
through the sky. So, while the Moon takes one month to go around the Earth, and the Sun takes one year, each of the nodes takes about 18.6 years to make one orbit! This turns out to be a very important point when it comes to
predicting eclipses.
You now have controls that can move everything you see. You can rotate the Earth, you can move the Moon and the Sun, and you can even spin the nodes around. This can let you visualize what is happening with each piece of the eclipse puzzle. Just always keep in mind that the time scale for each of these motions is very different!
Also keep in mind that we've put the nodes and the Moon pretty much at random places. The Day of the Year only applies to the Sun, as it is entirely possible for the nodes and the Moon to be at any point in their respective orbits on any given day. The Sun, however, will always be in the same spot in the sky on the calendar date shown.
We've also made the Sun and Moon quite a bit larger than they are in the actual sky. The sizes we've selected are a compromise between making them actual size (in which case you'd hardly be able to see them!) and making them too big (where we couldn't show anything realistic about how eclipses happen). This is an educational tool, not a rigorous celestial mechanics prediction computer!
What you should notice on this diagram is how the Moon, Sun, and nodes have to line up almost perfectly in order for any kind of eclipse to happen. For a solar eclipse, the Sun and Moon have to be at the same spot in the sky at the same time. But even if that happens, if they're not both located at a node, then the Moon will go "over" or "under" the Sun, and there won't be any eclipse! This is in fact what happens the vast majority of times the Moon and Sun have the same RA.
But at very special times, when it just so happens that the Sun and Moon are in the same spot in the sky at the same time, AND they are at a node. Then we have an eclipse! Try setting up one of those cases for yourself, and see if you can see the Moon's shadow on the Earth!
And if you put the Sun at one node, and the Moon at the opposite node, then you'll be treated to a lunar eclipse - just like in the real sky.
You might be tempted to think that you can "line up" the Earth, Moon and Sun in such a way that a lunar or solar eclipse can happen when the Sun and Moon are at locations other than the nodes. It sounds tempting, but the scale of this diagram doesn't show the true distances we see in the real universe. If the Sun is high in its orbit, and the Moon is low in its orbit, then the "line" between them won't intersect the Earth at all. We're sorry the diagram doesn't show it as clearly as we'd like, but that is in fact the way it works in real life!
Relative Sizes
We've also given you a control that changes the relative size of the Moon with respect to the Sun. We can't show it in this diagram, but the orbits of the Moon around the Earth, and of the Earth around the Sun, are not perfect circles.
What this means is that sometimes the Moon and Sun appear to be slightly larger or smaller in the sky than at other times. Because of this, sometimes the Moon looks like it's just a bit slightly smaller than the Sun, and sometimes slightly
larger. You'd never notice this, unless you were an astronomer with measuring equipment, OR... during a solar eclipse!
If a solar eclipse is happening, and the Moon is slightly larger than the Sun, then we'll see a total eclipse. If the Moon is slightly smaller than the Sun, then we'll have what's called an "annular" (ring-shaped) eclipse. In this case, the Moon won't be able to cover the Sun completely, and there will be a ring of sunlight around the Moon. The eclipse will not be total.
The control we've given you allows you to set the Moon's size relative to the Sun, and you can make it go from the smallest possible ratio to the largest. This will let you simulate an annular eclipse as well as a total eclipse.
It is even possible to have the Moon and the Sun appear so close to the same size, that the Moon just barely covers the Sun during the middle of an eclipse, but doesn't cover it completely during the beginning and end of the eclipse. That is because the Earth's surface curves away from the Moon, and at the sunrise and sunset points that observing spot on Earth is just far enough away from the Moon that the eclipse is annular at those times! This is a pretty rare eclipse, but it's common enough that many people call these types of eclipses "Hybrid" eclipses. Most astronomers prefer the name "annular-total", since that's what's going on as the Moon's shadow makes its way across the surface of the Earth.
We've mentioned this to you, because the eclipse of April 20, 2023 will be an eclipse of this type. Most people will observe the total phase of this eclipse from Indonesia, and a tiny spot in far Western Australia.
The true motions of the Earth, Moon and Sun are very complicated, as you can see. Elliptical orbits, nodes slowly revolving.... We're only narely scratching the surface here, when it comes to eclipse predictions! But hopefully this is helping you gain a better understanding of how careful we need to be in order to do all those calculations.
Controls:
You can always pinch the screen or use the control at left to zoom in and out of the diagram, and your left and right mouse buttons to move and rotate the whole diagram.
Reset Equator
Use this button to level the Earth's equatorial plane.
Relative Size
This control lets you change the Moon's size relative to the Sun, to simulate what we observe in real life in the sky!
Time Speed
A version of this "speed" slider is present in almost all the diagrams, and allows you to move the objects in the diagram at varying speeds. Click and hold the slider control, and the more you drag it to the right, the faster things will move. Release it to
have it snap back to the left and stop the motion.
This slider controls the motions of all three bodies in the diagram.
Rotate the Earth
Lets you rotate the Earth, just like before. This time, if you are simulating a solar eclipse, you can see the Earth rotate underneath the Moon's shadow! (But please wait till the next diagram before you tell us that the eclipse should be moving
from East to West over the Earth!)
Day of the Month
This slider moves the Moon around the Earth for an entire hypothetical month. No particular day is being represented here; it's just to show the Moon's motion relative to the Sun and the nodes.
Day of the Year
This slider moves the Sun in its path through the ecliptic for an entire hypothetical year. Again, no particular year is being represented here, though the date label is reasonably accurate with respect to where the Sun is in the sky during the course of a given year.
What you can learn:
- You can see what causes eclipses, and why they can only occur when the Moon and Sun are very close to the nodes of their respective paths through the sky.
- You can get a feel for how these important objects in the sky are moving over the course of time.
- You can simulate eclipses for yourself, including both total and annular solar eclipses.
- You can gain an appreciation for just how beautiful the relationships between the motions of the celestial objects are.
- You can also gain an appreciation of how brilliant the ancient scientists were, to have discovered and documented all this, without the aid of telescopes, computers or even Calculus!
Combining the Motions of the Sun, Moon, and Nodes
We've brought it all together for you, and given you a tool for observing the relative motion of all the main players in the eclipse game!
See the instructions for Diagram 10Collapse instructions
Diagram 10:
Combining the Motions of the Sun, Moon, and Nodes
What you're looking at:
We have flattened the orbit of the Moon around the Earth, and the gray horizon circle in the center of the sphere is parallel to that orbit. You can move the Moon up and down in declination, and you can move the Moon around the Earth. (The Sun's direction is fixed.)
We've also added an inset view of the Moon as seen from Earth, so you can watch the Moon's phase change as it moves in its monthly orbital path.
Controls:
You can always pinch the screen or use the control at left to zoom in and out of the diagram, and your left and right mouse buttons to move and rotate the whole diagram.
Reset Equator
Use this button to level the Equator.
Relative Size
This control lets you change the Moon's size relative to the Sun, to simulate what we observe in real life in the sky!
Time Speed
A version of this "speed" slider is present in almost all the diagrams, and allows you to move the objects in the diagram at varying speeds. Click and hold the slider control, and the more you drag it to the right, the faster things will move. Release it to
have it snap back to the left and stop the motion.
This slider controls the motions of all three bodies in the diagram, as well as the nodes.
Day of the Month
Move this slider to move the Moon around the Earth and see the phases. In the next diagram we'll show how the Moon also changes declination as it moves around the Earth.
Day of the Year
This slider moves the Sun in its path through the ecliptic for an entire hypothetical year. Again, no particular year is being represented here, though the date label is reasonably accurate with respect to where the Sun is in the sky during the course of a given year.
Nodes
This slider moves the nodes around, covering one full revolution through the Zodiac in a bit over 223 months. That's 18.6 years! This also means that the nodes can be in any constellation; this is why eclipses can happen at any time of year.
Please also notice that the nodes move in the "opposite" direction from the motion of the Sun and Moon.
Earth Rotation
Again, you can rotate the Earth to simulate the Sun shining on different parts of it as the day progresses.
What you can learn:
- You can see what causes the phases of the Moon.
- You can see a very simplistic model of why eclipses happen.
- You can learn why eclipse can happen anywhere along the Ecliptic, and at any time of year - but only at very special times!
Apparent and Real Motion of the Sun and Moon
Here, you’ll see how the Moon and Sun appear to be moving in the sky, and how they’re actually moving!
See the instructions for Diagram 10aCollapse instructions
Diagram 10a:
Apparent and Real Motion of the Sun and Moon
What you're looking at:
This diagram is designed to answer a question many people have when they begin to study astronomy: If the Moon and Sun rise in the East and set in the West, how can it be that they actually move from West to East? And why do eclipses proceed from West to East?
The easy answer is that the Earth spins on its axis once a day, and so for those of us who are spinning with the Earth, it looks like things are moving from East to West. This diagram breaks the situation down for you, so you can see the true motions easily.
We’ve kept many of the same features from previous diagrams: You have the red, blue and green arcs that form the equator, the ecliptic and the Moon’s orbital path through the sky. The RA/Dec grid and some stars are there for reference, and The Sun and Moon are in place together, ready to show you their real and apparent motions in the sky.
The Moon’s Motion
The Moon orbits the Earth once per month. Depending on how you want to set the exact start and end dates for the “month” (there are at least FIVE different types of month in astronomy!), the exact length of a month varies from just over 27 days to about 29.5 days (give or take). In this diagram, we’ve used 28 days for our month because it’s a nice round number, it represents exactly 4 weeks, and the basic idea of what we’re trying to show doesn’t depend on it anyway.
The Moon orbits the Earth from West to East. That means that if you are situated above the North Pole of the Earth, the Moon appears to move counterclockwise. Said another way, if you are facing South in the Northern Hemisphere, the Moon’s orbital motion carries it from “right” to “left” across its path in the sky. In the Southern Hemisphere facing North, that motion would be from “left” to “right”.
It is common knowledge that if you walk outside to look at the Moon, and you note its position in the sky, you can go out a couple of hours later and it will appear to have moved in the opposite direction that we just described! What is going on?
There are two factors in play here: First, this motion of the Moon in its orbit is comparatively very slow. After all, it takes the Moon an entire month to go all the way around the sky once! Second, the Earth is rotating. The motion you’re seeing when you watch the Moon over the course of an evening is much faster, and makes it appear to move all the way across the sky in the course of a single night! That’s because this motion is due to the rotation of the Earth, and that makes the Moon appear to move from East to West in the sky. Since the Earth spins faster than the Moon actually moves, this makes it look like the Moon is moving in one direction, when it’s really moving in the other direction.
If you’re in a car, driving down the road, and you come up on a car that’s moving slower than you are, then if you were able to wipe away all the outside references (like houses, trees, lines on the road, etc), it would look to you as though the other car were moving backwards! It’s really moving forward, but because it’s not moving as fast as you, you pass it up and leave it behind. There’s no difference in the relative speeds or positions between your two cars in this situation than if it were sitting still and you drove past it slowly, or if you were sitting still and it really were moving backwards! And it’s the same thing with the motion of the Moon.
The Sun’s Motion
There are similarities and differences between the apparent motion of the Sun and Moon. The Earth is spinning the same in both cases, but the Sun is not actually moving in orbit around the Earth! The Sun’s path through the Zodiac takes it an entire year to complete, and as we’ve already seen, that’s because in this case it’s the Earth doing the revolving. The Sun’s situation isn’t as intuitive as the Moon’s for several reasons: First, there are no stars next to the Sun that we can see, to judge it’s movement across the sky due to Earth’s orbit. Second, that movement is very slow, taking the Sun an entire year while the Moon speeds around the sky in a month! Third, it’s not really the Sun that’s moving – it’s the Earth! We have to pretend it’s the Sun that’s moving because that’s what it looks like to us. And finally, the daily motion of the Sun looks huge to us (the same as the Moon), but that’s because the Earth is spinning and taking us along for the ride! This combination of slow movement, lack of frame of reference, and very familiar pattern of “Rise in the East and set in the West” conditions us not to be able to visualize what’s really going on.
Two scenarios shown by the diagram
This diagram clears things up somewhat by separating these two motions entirely. First, you can spin the Sun, Moon and the Moon’s node around to put things wherever you want them. You can put the Sun high or low in the sky, and high or low along the ecliptic. You can put the Moon’s declination above or below the Sun’s. You can even rotate the “Apparent Motion” slider to put the Sun above the horizon while it’s in any part of the Zodiac that you want. None of that will matter when it comes to showing you the Real and Apparent motions of the Moon and Sun, because those don’t ever change.
Once you have things how you want them, then the fun starts!
Showing the Real Motion
This one is the easiest to see, and it matches what we’ve shown you in previous diagrams. You can use the regular slider to show all the movements over the course of a month, or you can use the Speed slider to keep things moving in a continuous loop. You’ll notice the Earth is also spinning, because from the point of view of the Solar System, that’s what’s really happening.
Notice that the Moon is moving much faster than the Sun through the sky. Every month it catches up to the Sun and overtakes it. We never see this happen, because at these times, it’s a New Moon – the far side of the Moon is lit by the Sun, and we can’t see it (except during a solar eclipse!).
Showing the Apparent Motion
In this situation, we stop the Earth completely and move the sky and everything in it. If you use the regular slider, you see the motions over the course of a day, and everything appears to move from East to West just like you’d expect. You can see the Sun, Moon and Stars moving in the same direction in the sky as we’re all used to.
But if you set things up so that the Sun and Moon are close to each other, and you put them next to some stars to use as a reference, then you’ll see something interesting. Use the Apparent Motion Speed slider to run the scenario for a day or two, and you’ll see that the Moon has moved in its orbit (toward the East). In relation to the Sun, it will have appeared to move quite a distance even in just one day. That’s because it’s got the same orbital motion as it did before, when you used the Real Motion slider. That motion hasn’t stopped, just because things now look like they’re spinning around the sky in the other direction.
In fact, if you run the Apparent Motion Speed slider for a few days, you’ll also be able to see that the Sun has crept along in its orbit as well. Run it for a year, and the Sun will make it all the around the sky, moving from West to East, even as it dutifully rises each day in the East and sets in the West!
It’s interesting to compare what you’re seeing here to the real sky. Put the Moon and the Sun in the same spot, and run the Apparent Motion slider for one day. You’ll see that the Moon has moved about 15 deg – one line of RA in our grid. This is a large distance in the real sky – about 30 Moon diameters – and is much larger than it appears here because we’ve made the Moon and Sun appear about 7 times larger in the sky than they really are. But if you go outside and look at the Moon’s location relative to a star, and then you go out the next night and find that same star, you’ll see that sure enough, the Moon has moved quite a long distance toward the East. You’re seeing the result of the Moon moving in its orbit!
The Moon’s motion in its orbit can also be observed during eclipses. More about that in future diagrams!
Controls:
You can always pinch the screen or use the control at left to zoom in and out of the diagram, and your left and right mouse buttons to move and rotate the whole diagram.
Show Observer
If you check the checkbox, you’ll see a little green observer standing on top of the Earth.
The horizon we’ve drawn with the gray disk and the blue circle are the horizon this observer would see. Uncheck the box to hide the observer.
Reset Horizon
It's not always easy to get the view exactly the way you want it. Use this button to get the horizon level again!
Rotate the Earth
You can spin the Earth to put the observer right on your location. This will show you the objects in the sky exactly as they appear from where you are.
Latitude
As in the earlier diagrams, this positions you somewhere on Earth at a given latitude.
Moon
This control allow you to place the Moon anywhere you want along its path.
Sun
Just like with the Moon slider, you can use this control to place the Sun anywhere you like along its path - the Ecliptic.
Nodes
With this control, you can set the position of the Ascending and Descending Nodes of the Moon’s orbit. You can use it after you’ve set the Moon and Sun’s position in their orbits, to cause the Moon’s declination to be above, below, or equal to the Sun’s.
Real Motion Speed
A version of this "speed" slider is present in almost all the diagrams, and allows you to move the objects in the diagram at varying speeds. Click and hold the slider control, and the more you drag it to the right, the faster things will move. Release it to
have it snap back to the left and stop the motion.
This slider controls the motions of all three bodies in the diagram, as well as the nodes. You can only move it in one direction – the direction things really move.
Real Motion
This slider does the same thing the Speed slider does, but only over the course of one month.
Apparent Motion Speed
A version of this "speed" slider is present in almost all the diagrams, and allows you to move the objects in the diagram at varying speeds. Click and hold the slider control, and the more you drag it to the right, the faster things will move. Release it to
have it snap back to the left and stop the motion.
This slider holds the Earth still, and spins the entire sky just like we observe in our daily lives. But if you spin it enough, you’ll see that the Moon and Sun are also moving in their orbits – according to their real motions! You can only move it in one direction – the direction things really appear to move.
Apparent Motion
This slider does the same thing the Speed slider does, but only over the course of one day.
Something Extra
We’ve seen how the Moon, Sun and stars appear to move over the course of an evening, due to the Earth’s rotation.
When astronomers are using a telescope to observe a star or other object in the sky, the spinning Earth would normally cause that star to be quickly carried out of the field of view. Astronomers compensate for this by having drive motors slowly turn their telescopes in the opposite direction from the Earth’s rotation.
This keeps things nice and centered, and prevents them from continually having to manually adjust where their scopes are pointing.
The Earth spins at exactly one speed, so the stars all move through the sky at the same angular speed. Telescope mounts are designed so that the drive motor can turn at the same rate, and that rate of compensating motion will work for any star or deep-sky object the astronomer wants to study.
Because the Moon moves so far in its orbit every day, the combination of Earth spin and Moon orbit makes the Moon’s apparent motion just a bit slower than the stars’. If our astronomer uses the standard drive motor on the scope which works perfectly for stars, then over the course of even 15 minutes of observing, that motor won’t be enough to keep the Moon from drifting through the field of view. Therefore, telescope drive motors have to have a separate, slower “Lunar” setting that must be used when viewing the Moon!
What you can learn:
- You can see why objects in the sky appear to rise in the East and set in the West.
- You can learn that the Moon and Sun are really moving from West to East.
- You can learn that this doesn’t change with your location on Earth, or the time of year.
- You can see how the Moon moves against the background of stars over the course of several days.
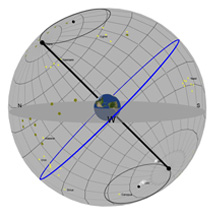
Precession Basics
Here are the basics about Precession of the Earth's orbit.
See the instructions for Diagram 11Collapse instructions
Diagram 11:
Precession Basics
What you're looking at:
We're back to the basic stars and constellations now, but we've added two circles near the NCP and SCP. These are the "Precession Circles". The gray horizon circle is in place as well.
Controls:
You can always pinch the screen or use the control at left to zoom in and out of the diagram, and your left and right mouse buttons to move and rotate the whole diagram.
Show Observer
If you check the checkbox, you’ll see a little green observer standing on top of the Earth.
The horizon we’ve drawn with the gray disk and the blue circle are the horizon this observer would see. Uncheck the box to hide the observer.
Reset Horizon
It's not always easy to get the view exactly the way you want it. Use this button to get the horizon level again!
Reset Date
The Precession slider covers a LOT of years! In case you're having a hard time getting back to a date near today, use this button to set the year to the current year on your device.
Rotate the Earth
You can spin the Earth to put the observer right on your location. This will show you the objects in the sky exactly as they appear from where you are.
The label on this slider at the right is the observer’s longitude.
Precession
This is the most important slider on the diagram! When the diagram loads, you'll see this slider labeled with a year that is very close to today.
For reasons that are outside the scope of this discussion, the Earth slowly "wobbles" in its orbit over thousands of years.
We call this wobbling "Precession", and it causes the entire RA/Dec grid in the sky to move. More importantly, it causes the NCP and SCP
to move in a circle, and the poles complete an entire revolution around these circles every 25,772 years (give or take!). By moving the precession slider left and right,
you can see where the poles have been,
as well as where they're going to be in the future. It's interesting to see where the NCP was located at the time the Pyramids were being built;
you can read about how they're aligned to the compass points
as they existed thousands of years ago - points that are much different than today!
(There are also similar variances with the compass points that have been discovered at archaeological sites at Stonehenge and in Mesoamerica.)
We'll cover some additional topics in the next couple of diagrams as well.
As in previous diagrams, if you click on the precession slider, you'll be able to use your arrow keys to move slowly through the years. You won't see much change from year to year, but you will certainly see things change over the course of hundreds or thousands of years!
We need to note that we've centered the precession slider near the current epoch (meaning, today!), and we haven't set it up so you can go hundreds of thousands of years into the past of future. The reason for this is that scientists aren't at all certain that our current observations and results to years can be reliably extrapolated to dates that are so far removed from the present. We're just trying to show the concept of precession - not to predict what the sky might have looked like during the Age of the Dinosaurs!
Latitude
As before, this slider moves your view to a different latitude on Earth.
This can allow you to see how changes in precession have affected the North and South Circumpolar stars.
Time Speed
A version of this "speed" slider is present in almost all the diagrams, and allows you to move the objects in the diagram at varying speeds. Click and hold the slider control, and the more you drag it to the right, the faster things will move. Release it to
have it snap back to the left and stop the motion.
This slider controls the motions of the stars moving across the sky on their daily (apparent) path around the Earth.
Sidereal Time
This slider does exactly what it did before - it moves the stars across the sky over the course of a day. But this time, if you've changed the date using the Precession slider, the stars will have taken on their NEW RA/Dec coordinates! Everything
we've said in previous diagrams about RA and Dec applies here as well, except you have to remember that the stars will all have new coordinates as we move this far in time. Different stars might now have become circumpolar!
What you can learn:
- You can visualize the "precession" of the Earth's rotational pole.
- You can see how the stars change RA and Dec over a great many years.
- You can learn why astronomical monuments from past great civilizations are precisely aligned to compass points that no longer exist.
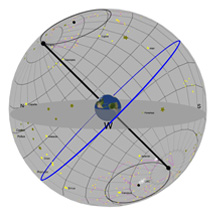
The Precession Path of the Earth's Poles through the Sky
We've added the constellations near the NCP and SCP,
so you can see how the Earth's poles will move through the stars.
See the instructions for Diagram 12Collapse instructions
Diagram 12:
The Precession Path of the Earth's Poles through the Sky
What you're looking at:
This is the same as Diagram 11, but we've added constellations near the NCP and SCP. These will show you the Precession Circle paths through the field of actual stars.
You can click on any star in those constellations to see the name of that constellation.
Controls:
You can always pinch the screen or use the control at left to zoom in and out of the diagram, and your left and right mouse buttons to move and rotate the whole diagram.
Show Observer
If you check the checkbox, you’ll see a little green observer standing on top of the Earth.
The horizon we’ve drawn with the gray disk and the blue circle are the horizon this observer would see. Uncheck the box to hide the observer.
Reset Horizon
It's not always easy to get the view exactly the way you want it. Use this button to make the horizon level again!
Reset Date
The Precession slider covers a LOT of years! In case you're having a hard time getting back to a date near today, use this button to set the year to the current year on your device.
Rotate the Earth
You can spin the Earth to put the observer right on your location. This will show you the objects in the sky exactly as they appear from where you are.
The label on this slider at the right is the observer’s longitude.
Precession
It's the same as in Diagram 11! In case you haven't seen that one yet, though:
This is the most important slider on the diagram! When the diagram loads, you'll see this slider labeled with a year that is very close to today. For reasons that your teacher will explain in the
lesson, the Earth slowly "wobbles" in its orbit over thousands of years. We call this wobbling "Precession", and it causes the entire RA/Dec grid in the sky to move. More importantly, it causes the NCP and SCP
to move in a circle, and the poles complete an entire revolution around these circles every 25,772 years (give or take!). By moving the precession slider left and right, you can see where the poles have been,
as well as where they're going to be in the future. It's interesting to see where the NCP was located at the time the Pyramids were being built; you can read about how they're aligned to the compass points
as they existed thousands of years ago - points that are much different than today! (There are also similar variances with the compass points that have been discovered at archaeological sites at Stonehenge and in Mesoamerica.)
We'll cover some additional topics in the next couple of diagrams as well.
As in previous diagrams, if you click on the precession slider, you'll be able to use your arrow keys to move slowly through the years. You won't see much change from year to year, but you will certainly see things change over the course of hundreds or thousands of years!
We need to note that we've centered the precession slider near the current epoch (meaning, today!), and we haven't set it up so you can go hundreds of thousands of years into the past of future. The reasons for this is that scientists aren't at all certain that our current observations and results can be reliably extrapolated to years that are so far from the present. We're just trying to show the concept of precession - not to predict what the sky might have looked like during the Age of the Dinosaurs!
Latitude
As before, this slider moves your view to a different latitude on Earth. This can allow you to see how changes in precession have affected the North and South Circumpolar stars.
Time Speed
A version of this "speed" slider is present in almost all the diagrams, and allows you to move the objects in the diagram at varying speeds. Click and hold the slider control, and the more you drag it to the right, the faster things will move. Release it to
have it snap back to the left and stop the motion.
This slider controls the motions of the stars moving across the sky on their daily (apparent) path around the Earth.
Sidereal Time
This slider does exactly what it did before - it moves the stars across the sky over the course of a day. But this time, if you've changed the date using the Precession slider, the stars will have taken on their NEW RA/Dec coordinates! Everything
we've said in previous diagrams about RA and Dec applies here as well, except you have to remember that the stars will all have new coordinates as we move this far in time. Different stars might now have become circumpolar!
What you can learn:
- You can visualize "precession" of the Earth's rotational pole.
- You can see how the stars change RA and Dec over a great many years.
- You can learn why astronomical monuments from past great civilizations are precisely aligned to compass points that no longer exist.
- You can see why Polaris is only temporarily serving as our North Star, and why the southern hemisphere will eventually get its turn at having a pole star!
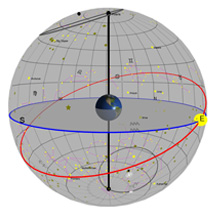
The Effects of Precession on the Seasons and the First Point of Aries
We've brought back the Zodiac and the Ecliptic,
so you can see how precession could affect things over the long term!
See the instructions for Diagram 13Collapse instructions
Diagram 13:
The Effects of Precession on the Seasons and the First Point of Aries
What you're looking at:
Now, we have the Sun and the Ecliptic back, as well as all the constellations of the Zodiac. All the precession functions are in place as well, so we can see what might happen over a very long period of time.
Controls:
You can always pinch the screen or use the control at left to zoom in and out of the diagram, and your left and right mouse buttons to move and rotate the whole diagram.
Reset Horizon
It's not always easy to get the view exactly the way you want it. Use this button to get the horizon level again!
Reset Date
The Precession slider covers a LOT of years! In case you're having a hard time getting back to a date near today, use this button to set the year to the current year on your device.
Precession
It's the same as in Diagrams 11 and 12. Here is what we said about it before:
This is the most important slider on the diagram! When the diagram loads, you'll see this slider labeled with a year that is very close to today. For reasons that your teacher will explain in the
lesson, the Earth slowly "wobbles" in its orbit over thousands of years. We call this wobbling "Precession", and it causes the entire RA/Dec grid in the sky to move. More importantly, it causes the NCP and SCP
to move in a circle, and the poles complete an entire revolution around these circles every 25,772 years (give or take!). By moving the precession slider left and right, you can see where the poles have been,
as well as where they're going to be in the future. It's interesting to see where the NCP was located at the time the Pyramids were being built; you can read about how they're aligned to the compass points
as they existed thousands of years ago - points that are much different than today! (There are also similar variances with the compass points that have been discovered at archaeological sites at Stonehenge and in Mesoamerica.)
As in previous diagrams, if you click on the precession slider, you'll be able to use your arrow keys to move slowly through the years. You won't see much change from year to year, but you will certainly see things change over the course of hundreds or thousands of years!
We need to note that we've centered the precession slider near the current epoch (meaning, today!), and we haven't set it up so you can go hundreds of thousands of years into the past of future. The reason for this is that scientists aren't at all certain that our current observations and results can be reliably extrapolated to years that are so far from the present. We're just trying to show the concept of precession - not to predict what the sky might have looked like during the Age of the Dinosaurs!
Day of the Year
As in previous diagrams, this allows you to move the Sun through the Zodiac - effectively setting the day of the Year. But now, we have the added feature of precession built in. This lets you see how the First Point of Aries,
the Ecliptic, and therefore the seasons themselves, move through the months over long periods of time...
...or rather, how these WOULD move, if not for our current calendar system.
That's right! The current system we have of adding leap days to certain years, is carefully designed to AVOID having the seasons shift like this over the centuries. In our diagram, we've only accounted for a 365-day year. As we know, every four years we put a "leap day" into our year and call it the 29th day of February. This effectively stops the slow progression of the seasons through the calendar, and ensures that the shift we're seeing in this diagram does not actually take place!
Why did we bother to include it then? And why don't we have a diagram that shows what actually happens? Well, we're showing it because it is important to understand why it's so important to have those leap days, and to show what happened in the past when we didn't have them. And we can't show a diagram of how the calendar prevents this, because nothing much would happen! Even over thousands of years, the ecliptic and the seasons would hardly move at all - and that would be a pretty boring diagram.
Let's talk about that calendar, and the leap day system, for just a bit. First, there are more than 365 days in a year. It takes the Earth about 365 and a quarter days to make it all the way around the Sun. So, by adding a leap day every four years, we're making up for that yearly loss of a quarter day that we'd otherwise experience.
But of course, the Earth's orbit isn't exactly 365.25 days. That would be way too easy! It's just a tiny fraction short of that number, and so we can't keep continually adding leap days every four years or we'd eventually have exactly the kind of calendar drift we're trying to avoid. As it turns out, if we did that we'd end up ahead by about 3 days every 400 years. So, that's taken care of in the calendar by making every century year not be a leap year, unless it's divisible by 400. That means that years like 1700, 1800, and 1900 were all not leap years - but 1600 and 2000 were. 2100, 2200, and 2300 will not be leap years, but 2400 will be - and so on. This little adjustment to the "every four years" rule is all we need to make the calendar accurate until at least the year 4500 or so (By which time, it will surely have become someone else's problem!) And by then, other factors will come into play that will make some refinements necessary in any case.
This complicated-yet-accurate leap day system, by the way, was put in place in October of 1582, and was championed by Pope Gregory XIII. Therefore, our calendar is known to this day as the "Gregorian" Calendar.
Rotate the Earth
This does what it's always done - spins the Earth so you can put whatever part of it you want into daylight.
What you can learn:
- You can visualize the "precession" of the Earth's rotational poles as they move through the circumpolar constellations.
- You can see how the Ecliptic - and therefore, the seasons - would move over a great many years.
- You can learn why our Gregorian Calendar is so useful, and so necessary.
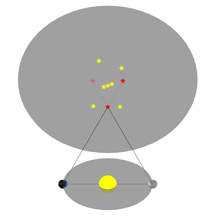
Parallax
Learn the basics of one way to measure the distance to the closest stars!
See the instructions for Diagram 14Collapse instructions
Diagram 14:
Parallax
What you're looking at:
There's no sphere in this diagram. You're looking at two flat plates: One is a horizontal plate in the foreground, containing the Sun and Earth, and the other is a vertical plate off in the distance, containing some far-away stars.
The purpose of this diagram is to show you one method astronomers have of being able to measure the distance to stars that are relatively close to us. It's kind of the same situation you can see when you hold one finger up at arm's length and look at far-away things by first closing one eye, and then the other. Your finger appears to "jump" against the background, and the closer you bring your finger to your face, the more it appears to jump.
In this example, the nearby red star is like your finger, and your left and right eyes are the view we have of the star when the Earth is on oppposite sides of its orbit around the Sun. To do the experiment, we take a measurement of the red star's position against the background of more distant stars, and then six months later we take the same measurement and see how the target star has appeared to become displaced - to "jump" against the background. A little geometry does the rest, and we have a pretty good approximation of the distance to the red star!
(That's actually pretty amazing, that we can get reasonably accurate results with such simple math. Most computations in astronomy involve ultra-complicated Physics and Calculus, so it's nice to see results as important as star distances be reduced to something we all can understand from high school math!)
But back to reality: In order to do this with any accuracy at all, we need to be able to measure the relative positions of stars very accurately; the jump we see in the star's position isn't anywhere even close to as much as it appears in this diagram! And also, we need to use background stars that we know are far away - and they have to lie in the background of the field of view of our target star. The star we're measuring also has to be very close to us, relatively speaking - the method won't work with far-away stars, since the amount of displacement we would observe just isn't enough to measure accurately. But this is one method that has been used, and it's all we had until many of the great cosmological discoveries of the early 20th Century came along.
Finally, we'll let you know a fact that most people don't think about. During a total eclipse, people in the narrow path of totality see the Moon pass directly in front of the Sun. People on Earth who are only a handful of kilometers outside that path will see the Moon pass "above" or "below" the Sun in the sky, and they won't see totality. This is because of parallax! That's right, the position of the Moon in your particular sky varies quite a bit, depending on where on Earth you're located. So, even though the Full Moon might be rising for you in the early morning, at the same exact time it is setting for someone on the other side of the Earth during their evening, you can be sure that the location of the Moon in the sky relative to the background stars is very different for both of you!
Controls:
You can always use your left mouse button to move the diagram in two dimensions to see it more "top-down" or "edge-on".
Near star distance
You can move the red star closer or farther away from Earth, and see how its movement over the six-month time frame changes. If you move it too close, it'll move off the screen on
both sides (and there aren't any stars that are that close to us in the real sky anyway!). If you move it far enough away, it'll be at the distance of the background stars, and the method
fails because the star won't "jump" as much between the two observations.
We should also note that we used the stars of Orion as the "distant" star background. The stars of Orion are in general pretty far away, relatively speaking - but the experiment in real life would use very dim stars that are much further away from us than the few-hundred-light-year distances to the more famous stars of Orion!
Day of the Year
Here, you can move the Earth from right to left in its orbit around the Sun, and see the triangles that form. Once you have the Earth all the way over to the left (the slider is
all the way to the right), then the set of two similar triangles is completely formed. At this point, you could use simple geometry to estimate the distance to your target star. Keep in mind that we
are talking about extremely small angles in play here - angles much smaller than an arcsecond, which is about 1800 times smaller than a full Moon! (More about that in diagram 16,
but we'll tell you here that an arcsecond is about the same size as if you were looking at a pea held up at a distance of about 700 yards [650 meters]!) So you have to be able to measure
things with an accuracy not very easy to achieve in your back yard.
There's one other little thing we'll mention to you. If you look very closely, you'll see that in our diagram, as the Earth moves around the Sun the projection of the red star against the distant stars appears to move a bit beyond the left and right limits that it eventually settles on. That's expected, because there are points the Earth reaches in its orbit where the sightline between it and the target star makes the star look farther out than it does when the Earth is at the left and right orbital extremes. In real life, this difference is vanishingly small, and if we were to try and use those two extreme locations for the experiment, we'd need to know the red star's distance in advance - which we don't. It's much easier to make these triangles be perfect isosceles triangles as much as possible, and that means using the two positions of Earth that are at exact opposite ends of its orbit.
In our diagram, we've also used 183 days as an approximate "half-Earth-orbit" duration. In reality, we'd need to use measurements taken at the exact times of orbital extreme for the year of our observation, as well as the location of our target star in the sky. We'd also need to take into account the changing distance between the Earth and the Sun over the course of the year.
So, as with everything else in astronomy, the reality is somewhat more complicated than the simplified picture. The diagram is designed just to give you the most basic idea of what the experiment entails.
Something Extra
In 2020, astronomers at NASA used the New Horizons probe to obtain new parallax information on two of the nearest stars.
After visiting Pluto and the Kuiper Belt object 486958 Arrokoth, New Horizons continued on its way into deep space.
By April of 2020, it was 6.9 billion km from Earth, and this gave astronomers the unique opportunity to employ the parallax method using a triangle with a much larger base than Earth’s orbit could provide.
Photographs of the stars Proxima Centauri and Wolf 359 were taken by the New Horizons craft, and compared to those taken here on Earth. As you might expect, these two nearby stars showed a remarkably large parallactic shift against the background of distant stars, and the measurements were used to confirm what we already knew about their distances. Proxima Centauri was confirmed to be 4.2 light-years away from us, and Wolf 359 still clocks in at 7.9 light-years!
What you can learn:
- You can see the basics of how astronomers would set up a parallax experiment to measure the distance to a nearby star.
- You can see how the experiment uses precise measurements, but very simple math, to do its job!
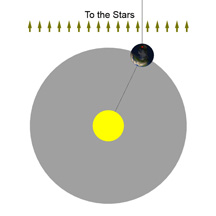
Sidereal vs. Solar Day
Here is a model to show you why there's a difference between the Sidereal and the Solar day.
See the instructions for Diagram 15Collapse instructions
Diagram 15:
The Sidereal vs. the Solar Day
What you're looking at:
You are looking down on the orbit of the Earth around the Sun. As the Earth makes a complete orbit, you can see the difference between what is called a "Sidereal" vs. a "Solar" day. The Sun is the yellow circle in the middle, and so this picture certainly fits what you're used to seeing on most astronomical models: "Diagram NOT to scale!"
(And because we don't want there to be any confusion, we'll tell you up front that "Sidereal" is pronounced "Sigh-DEAR-ee-ul"!)
Controls:
You can always use your mouse wheel to zoom in and out of the diagram, and your left and right mouse buttons to move and rotate the whole diagram.
Toggle Sidereal/Solar
This button switches you back and forth between the Sidereal and Solar Day corresponding to where you are in the Earth's orbit. For example, if you've moved the slider to where you're looking at the Earth's
position after 100 Sidereal Days, then this button will take you to the position at 100 Solar Days. You can rock the display back and forth to make the difference easier to see.
The only place where the number of Sidereal and Solar days will NOT be equal is at the very end of the "year" - where you can see that 366 Sidereal Days is the same as 365 Solar Days.
Sidereal Day and Solar Day sliders
These sliders are so interconnected that we're going to describe their actions together. Most diagrams that show this concept are really simplified, and we wanted to show you more about how the difference
between the two types of day affects things dramatically over the course of a year.
Some background
Let's first define what we mean by each type of day:
Solar Day
What we are used to using in our daily lives is a "Solar" day. In general, to get one Solar Day means we measure from the time that the Sun is high in the sky (like at noon) to when it is high in the sky the next day (also at noon). This seems like a very logical way to define a "day", but there are some complications. For starters, there's the fact that the exact time of "high noon" is different for observers at every longitude on Earth. If you are located in a big city like St. Paul MN, Dallas TX, Brooklyn NY, Tampa FL, Oakland CA, Raleigh NC or Bismarck ND, then you will experience the Sun being at its highest point just a few minutes earlier than folks directly to the west of you - in Minneapolis, Ft. Worth, Staten Island, St. Petersburg, San Francisco, Durham or Mandan. Keeping time based on a system like this would be pretty inconvenient, knowing that you had to keep track of what time it was in all the locations around you where your friends and family might live. This is exactly the problem that the railroads had, and it led almost directly to the establishment of "time zones" to try and standardize things.
But there's another complication that we will discuss in a later diagram: The Equation of Time. The Sun doesn't move through the sky at exactly the same speed over the course of a year. Its speed doesn't change that much, to be sure, but there's enough of a difference in the length of an actual Solar Day that if you're trying to keep time accurate to the minute, it's simply not possible to do without adjusting for what day of the year it happens to be.
What we are going to do in this discussion (and also in the one about the Equation of Time) is talk about a "Mean" Solar Day. In this case, "Mean" means "Average", and so we're going to imagine that there's this fake Sun up in the sky that always moves at exactly the same speed at all times. Sometimes that "Mean Sun" will be lagging behind the real one, and sometimes it will be ahead of it. If we note the time that this Mean Sun is at its highest point on one day, then it will be exactly 24 hours until it reaches its highest point on the next day. This is the only way we can keep the calculations reasonable at this stage, and it's not a bad approximation for now. If the lack of perfect accuracy bothers you, just imagine that we're talking about the real Sun, and you won't be far off. The concept still applies, but the numbers will be off just a slight amount.
(So from now on, whenever we say "Solar Day", we mean "Mean [or Average] Solar Day". Fair enough? OK!)
Sidereal Day
Now, what do we mean by a "Sidereal" Day? Well, we just talked about the time period between when the Sun is highest in the sky, and the next time it's highest in the sky. But what about the stars? We've seen how the stars culminate at different times of the day throughout the year, and this is where that drift comes from. We're used to measuring time using the Sun in our daily life, but astronomers wanted to have a time reference based on the stars. That's where the whole concept of RA came into play. They realized that the Earth rotated enough to get a given star from one culmination point to the next in just a bit less time than the Sun took to do the same thing. That's because during the day in question, the Earth moved a little bit in its orbit - and therefore, it took just a little bit longer for it to rotate further to the point where the Sun would be overhead again! It's not so much that the "star"-day was shorter, it was more that the "Sun"-day was longer because we hadn't accounted for the Earth's orbit. But it was too late, because everything had already been finialized based on the Sun. The astronomers just had to make their system adapt. (And by the way, this is MUCH easier to see in the diagram than to try and read about it!)
Once the Earth has rotated enough to make a complete Sidereal day, how much longer does it have to rotate in order to get the Sun back up to high noon again? That's where it's important to consider the full length of the year, and include that extra quarter day in our calculations. When all the dust clears, it turns out that the Solar day is longer than the Sidereal day by about 3m 55.91s. A little less than 4 minutes.
Four minutes doesn't sound like much, but if you start adding it up, it turns out to make quite a difference! Over a month (30 days x 4 minutes per day = 120 minutes...), it's about 2 hours! (Remember, 2 hours of RA is 30° of star movement, and 360° divided by that 30° per month gives us our full year's worth of 12 months.) And over the course of a whole year, it all adds up to (365 days x 4 minutes per day = about 24 hours...) an entire day! That's right, while there are 365 "regular" days (and change) in a year, there are 366 (!) (and change) Sidereal Days in a year.
How many days did we say were in a year? If you said 365, then you have to remember that the Earth takes about 1/4 day longer than that to actually make it all the way around the Sun. That's very important for our discussion, even though we're not going to include that extra day in our diagram. We're trying to compare what happens at the moment we land on each Sidereal or each Solar day, and we're not as concerned about what happens during that last fraction of a day...
...except for the fact that if we don't account for it, then our 3m 55.91s measurement will be off enough that we'll be a few minutes off by the end of the year - which isn't good. So we're going to keep the accuracy of the measurement over the course of the year, but we're going to stop the experiment just a bit before a full year is over. With sincere apologies to any astronomers out there who are by now yelling at their screens in horror at these terrible approximations - It'll be good enough! Again, we're trying to educate, not create an ephemeris!
How to use the sliders
The whole setup begins on a particular day of the year, with the Sun high in the sky and a certain stars or stars appearing to be just behind it in the sky. Of course, you can't see those stars, because not only is it in the middle of the day, but they're also hidden behind the Sun! It doesn't matter what day of the year it is, or where you're located on Earth. It only matters that we pick a time when the Sun is highest in the sky, and there are certain stars that are in the exact same direction as the Sun in the sky. That stars the experiment.
We'll call that starting point "Day 0" of the experiment. From here, you can move either one of the sliders to any point in the year that you want to. As you do, the other slider will move along with it. When you stop the slider, you'll be sitting on either a Solar or Sidereal day (depending on which slider you were moving.) The other slider will then show you how many of the other type of day is equal to the one you landed on. So for example, if you move the Sidereal Day slider to 100 Sidereal Days, you'll see that the Solar Day slider now reads 99.73 Solar Days. The Earth has turned 100 times with respect to the stars (which are far off in the distance, above the top of the diagram), but it hasn't made it around to where the Sun is directly overhead for the 100th Solar Day to have completed. There's still about a fourth of a day left, to get to that 100th Solar day.
We show you that difference between the two days very accurately; in this case, the Earth still has to rotate 6h 33m 11.0s to get to that 100th Solar Day. So after 100 days, that little 3m 55.91s difference has amounted to six and a half hours! Stars that culminated at midnight 100 days ago are now culminating at about 5:30pm. That means they're now setting at midnight, give or take.
But we've added a nice little feature that allows you to see this difference even easier. See the red dot on the Earth, and how it's at the "top" side of the Earth, pointing toward the distant stars? This is because you moved the Sidereal Day slider, and so everything is being based off having the stars overhead from one day to the next. If you now click the "Toggle Sidereal/Solar" button, you'll see the Earth move around about six hours' worth of rotation. Now, the red dot will be pointed toward the Sun because we've shifted gears - we're now talking about Solar days. You'll see that with that extra six hours of rotation, the diagram shows the situation after 100 Solar days, which is the same as 100.27 Sidereal days. We've moved 6 hours into the future - about a quarter of a day. And because of that movement, the difference between the two days has now increased a little more than a minute - which is about a fourth of the daily difference between the two types of day!
You can toggle back and forth between 100 Solar days and 100 Sidereal days as much as you want, to see the difference that little 4 minutes has made. The farther along in the year you go, the bigger that gap between Solar and Sidereal days will become!
Many diagrams will only show you this difference on one given day. Here, you can move the sliders to wherever you want during the course of an entire year's worth of days. As you move the Earth farther in its orbit, you'll see that the difference between x number of Solar Days and x number of Sidereal Days grows steadily. After a full year, that total difference will amount to an entire day.
What you can learn:
- You can see the difference between a Sidereal and Solar day at any point of the Earth's orbit.
- You can see how that difference adds up over the course of a year.
- You can learn why these two very different methods of determining the length of a "day" came into being.
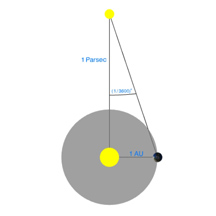
Distances in Astronomy - Definitions
Here are simple illustrations of the most basic distance units used in Astronomy.
See the instructions for Diagram 16Collapse instructions
Diagram 16:
Distances in Astronomy - Definitions
What you're looking at:
Here are six simple pictures that show you the definitions of six different distances used by astronomers.
Controls:
There is just one control: We've given you a slider to move back and forth between the different terms. As you move the slider to the right, the distances get bigger.
We'll use these terms in future diagrams, so please familiarize yourself with them!
Just to let you know, the term "Parsec" isn't used very much, but it is very convenient for astronomers who deal with the angular separation between stars that are really close together. What do we mean by "angular separation"? Well, you can't very well say that things in the sky are so many "inches" or "millimeters" apart. It also doesn't make sense to talk about how many miles or light-years apart they are, since that doesn't really say anything about how far they appear to be in the sky.
Therefore, astronomers will use degrees to talk about the separation between objects - the same degrees that we learn about in math class, where there are 360° in a full circle. This means that there are 90° from the horizon to the point straight overhead (called the "zenith"). Also, the Moon and Sun are about a half-degree in diameter as they appear to us on Earth.
A degree is divided into 60 "minutes" of arc, and each minute is divided into 60 "seconds" of arc. As you might imagine, a second of arc (or "arcsecond") is very small. If two stars were separated by 1 arcsecond, you wouldn't ever be able to see them as two separate stars. In fact, many people have a hard time seeing both stars if they are separated by a full arcminute - that's 60 arcseconds! But in a powerful telescope, it becomes possible to "resolve" stars that are very close together, and so the parsec is used many times in these instances where astronomers have to talk about these very small angular separations.
What you can learn:
- You can learn about six different terms that astronomers use when they describe distances in space.
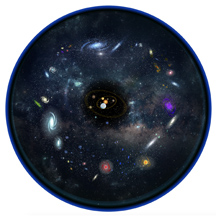
Distances in Astronomy - Examples
Now we'll use the terms we described before, to show you some distances between real astronomical objects.
See the instructions for Diagram 17Collapse instructions
Diagram 17:
Distances in Astronomy - Examples
What you're looking at:
We've given you 11 different pictures, that use the distance terms we just introduced you to. You can move the slider to go from one to the next, and as you move the slider to the right, the objects (and their distances) will get larger.
Controls:
Main slider
There is only one slider, and it moves you between the 11 different pictures we've given you. Each one has the indicated distance marked, using various units so you can see the differences.
What you can learn:
- You can see how different distance terms are used, in going from the smallest to the largest astronomical objects.
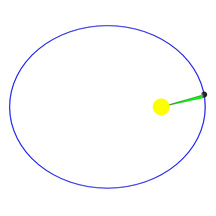
Kepler's Second Law
An illustration of orbital motion using real, elliptical orbits.
See the instructions for Diagram 18Collapse instructions
Diagram 18:
Kepler's Second Law of Motion
What you're looking at:
You are looking down on the orbit of an object around the Sun. It could be a planet, a comet, a spacecraft, or maybe an asteroid.
You will be able to set the shape of its orbit and see how Kepler's Second Law applies.
Controls:
Eccentricity Slider
This slider controls the shape of the elliptical orbit of the object, by setting what's called the "eccentricity" of the ellipse. The bigger this number, the "flatter" the ellipse.
A perfect circle has an eccentricity of 0, though no real objects have a perfectly circular orbit. An eccentricty of 1 would give us a parabola rather than an ellipse, so that's not included. In reality, only very rarely
do the orbits of objects get close to an eccentricity of 1. We've limited the eccentricity in this diagram to 0.9, because the orbit would get too flat for any value bigger than that.
Day of the Year Slider
This slider changes the day of the year, to move the object in its orbit around the Sun.
"Earth eccentricity" checkbox
If you check the box, the diagram will show you an orbit that matches the Earth's eccentricity of 0.01671. You'll see that it looks almost like a circle. Most diagrams have to exaggerate the orbital eccentricity in order
to show you the "equal area" concept (just like we had to!). In the real universe, the Earth's orbit is very nearly circular, and the concept would be almost impossible to show you. Here, with a diagram that matches the
Earth's actual orbit, you can see that there's not a lot of variation between the speed of the Earth on any given day, or on its distance from the Sun. That's a good thing, because it means we experience just enough orbital distance and speed
changes to make things interesting - without making it dangerous to be on Earth if it ever traveled too close to the Sun!
Kepler's Laws of Motion
Kepler's Laws were amazing at the time they were put forth in the early 17th century. They clarified Copernican theory, and they are brilliant in their simplicity.
Kepler's First Law
This one is the simplest. It states that objects orbit in paths that are shaped like ellipses rather than circles, and that the Sun is not at the center of the ellipse, but at one of the focuses. We'd have to
explain more about the mathematics of ellipses to you, to tell you what a focus is exactly. For now, we can say that if an orbit were a perfect circle,
then the Sun would be at its center. The flatter the oval of an orbit, the farther away from its center the Sun will be. You can see this reflected in the diagram.
Kepler's Third Law
Let's do the Third Law next, since it's very straightforward. This Law basically says that if you know how long it takes for something to go around the Sun, then you know how far out from the Sun it must be (or the other way around).
That sounds pretty obvious, but it was amazing to Kepler when he discovered it. We will use this law in a future set of diagrams about orbits. For now, it's enough to know that there is a simple relationship there between an orbit's period and its radius.
Kepler's Second Law
The Second Law is the least obvious of the three, but it is equally as important as the others. It states that objects in orbit sweep out equal areas of their orbital planes in equal times.
It is easiest to explain this by showing you in the diagram. If you set an eccentricity for the elliptical orbit, you'll see a green area that connects the planet to the Sun. This area is somewhat shaped like a triangle. Now, if you change the day of the year, so that the planet is moving along in its orbit, you'll see that green triangle follow the planet all the way around. Even though the planet's distance from the Sun changes, and therefore the green triangle goes from being shorter and wider to longer and thinner, the area in green stays the same throughout the whole orbit.
This doesn't seem like it's of much importance, because who cares about some invisible area out in space? It's important because of something that results directly from it: If you set the eccentricity high enough (maybe around 0.8), you'll see that when the planet is close to the Sun (when it's at the "right" of the Sun in the diagram), the amount of movement it makes in its orbit in one day is pretty large. At least, it's large compared to how much the planet moves in one day when it's far away from the Sun (over at the "left" of the Sun). This daily movement is the amount of the ellipse's circumference that is covered by the green triangle; i.e. the "width" of the "base" of the triangle. (This is not the same thing as the "Distance" we're showing in the caption; that's the distance the object is from the Sun on that day!)
Because this daily amount of orbital movement is changing over the course of the orbit, that means the speed of the planet is changing! When the planet is closest to the Sun (at a point called "perihelion"), it is moving the fastest that it ever will in its orbit. When it is farthest away (at a point called "aphelion"), it is moving slowest. This is a very critical fact, and thanks to the Third Law, we can obtain very accurate facts about the orbit using very simple math.
Using the sliders
You can see that as you set the eccentricity, the area of the green triangle will change (according to the Second Law). You can see its value in the caption. This area will not change again,
unless you change the eccentricity - the shape of the orbit.
If you then change the Day of the Year, the Speed of the planet will change as it moves around its elliptical orbit. If you happen to set the eccentricity at 0 (which means a circular orbit), then the speed won't change at all during the year. But remember, that doesn't happen in the real universe. The flatter you make the orbit, the more of a difference you'll see between the planet's speeds at aphelion and perihelion.
You might also wonder why we've fixed the planet's "year" at 365 days. Well, according to the Third Law, we know that if the average distance from the Sun is 1 AU, then the year will have 365 days in it. We've made these ellipses so that this distance remains constant for ellipses of any eccentricity, and that gives us the same number of days in the year!
What you can learn:
- You can see how eccentricity affects the shape of elliptical planetary orbits.
- You can see how Kepler's Laws determine orbital distance as well as the "equal areas in equal times".
- You can see how the orbital speed of an object changes during the course of its orbit.
- You can learn the terms "perihelion" and "aphelion".
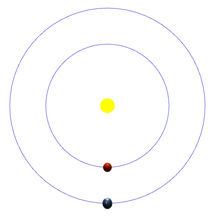
Conjunction and Opposition
See the motion of inner and outer planets relative to the Earth.
See the instructions for Diagram 19Collapse instructions
Diagram 19:
Conjunction and Opposition
What you're looking at:
You are looking down on the orbit of the Earth and another planet around the Sun. You can choose between having the orange-red planet be an inner planet (like Mercury or Venus) or an outer planet (like Mars), and see how it moves relative to the Earth as they both orbit the Sun.
We've compressed the entire Zodiac and placed it in a banner across the top, so you can see the apparent motions of the Sun and the outer planet as time goes on. For inner planets, we've kept the Sun stationary to help you see important events in the inner planet's orbit. For outer planets, we're keeping the stars stationary and letting the Sun and the outer planet move through the Zodiac as they normally do (as seen from Earth).
Controls:
Dropdown box for "inner" or "outer" planet
This dropdown box allows you to change back and forth between having the "other" planet (the orange-red one) be closer to the Sun than the Earth is (called an "inner planet"),
or farther away from the Sun than the Earth is (called an "outer planet"). We have two different pictures for these because some of the terminology that astronomers use for them
is different.
Planet orbital period Slider
This slider changes the distance of the orange-red planet from the Sun, and therefore (by Kepler's Third law), the number of Earth days it takes to orbit the Sun.
Speed slider
Just like all the other Speed sliders, this one allows you to watch as the Earth and the other planet continually orbit the Sun. You can move the slider to the right
to see the planets orbit in the correct direction, or move it to the left if you missed something and want to breifly go back in time to see it again!
Things to watch for
Here are some things you can see taking place in the banner at the top of the frame:
Inner Planets
You'll see that in all cases, the inner planet moves around the Sun faster than the Earth does. Also, the inner planet always stays relatively close to the Sun as we observe it from Earth;
even if its orbit is really close to Earth's (which it can't be in real life, if the planets are to have stable orbits), the inner planet can never get more than 90° away from the Sun.
Generally, it's much less than that.
Elongations
When the inner planet gets as far away from the Sun as it can, you'll see a label pop up that says "Greatest [eastern or western] elongation." This means exactly what it sounds like - it's the
farthest away from the Sun that the planet can ever appear to be. If the planet is on the "right" side of the Sun, that's a western elongation, and the planet will be visible in the morning sky because
it rises before the Sun does. If it's on the "left" side of the Sun, then that's an eastern elongation, and the planet will be visible in the western sky just after sunset. (We know, that sounds backwards.
The elongations are named for the position of the planet relative to the Sun, though - and if an object is to the west of the Sun in the sky, it rises and sets first. That's just how it works!)
We've chosen to keep the Sun centered in the banner at the top, because it represents the midpoint between the two elongations.
Conjunctions
There are also two situations when the Earth, the Sun and the inner planet are lined up in a straight line. These are called "conjunctions", because the inner planet and the Sun appear to us to be
in the same part of the sky. If you use the slider to keep the planets moving, you'll see this situation happen eventually. If you keep up the motion for long enough, you'll notice that this line-up
can happen in two ways: Either the inner planet is in between the Earth and the Sun, or it's on the other side of the Sun from the Earth. In the first case, we call this an "inferior conjunction". In the other
case, it's a "superior conjunction." You can remember that "inferior" is less than "superior", and in an inferior conjunction the inner planet's distance from Earth is smaller than during a superior conjunction.
Transits
We should mention that at Superior Conjunction, the inner planet will never be visible; it will be lost in the overwhelming light of the Sun! But from the diagram, it looks like we should actually be able to see the inner
planet at Inferior Conjunction. It looks like the planet is going to be moving across the face of the Sun, and we could use eclipse glasses or solar filters to be able to see it. But remember, we said we'd flattened the
Zodiac to show it in the band in the diagram. In real life, almost every time there's an Inferior Conjunction, the planet appears to be "above" or "below" the Sun on the Ecliptic, and so it won't be visible. This is very
similar to what happens with the Moon, which causes us not to have an eclipse every month.
To be sure, there are in fact times when Mercury or Venus do appear to pass across the face of the Sun. These events are called "transits", and they are reasonably rare. (For Venus, they are VERY rare.) The next couple of transits of Mercury will happen in 2032 and 2039, and the next one for Venus isn't until 2117. Mark your calendars!
Outer Planets
As we said earlier, the outer planets display milestones in their orbits as well. This time, there are four of them:
Quadrature
The outer planets don't have "elongations", because they can appear anywhere in the sky relative to the Sun. Astronomers have a term for the time they appear exactly 90° away from the Sun: "Quadrature". Just like with
elongation, there is an Eastern and a Western Quadrature - but nothing very special happens there. When this happens in the diagram, you'll see a popup telling you that it's happening.
Conjunction
Remember that "Conjunction" means that the planet and the Sun are at the same place in the sky. Just like with inner planets, you won't be able to see an outer planet when it's at conjunction; the Sun is too bright!
Opposition
The exciting moment in an outer planet's orbit is when it is at "Opposition". This means that it is in exactly the opposite part of the sky as the Sun, and that means it tends to be up and observable all night long.
But even better than that - the planet will be closest to the Earth at that time as well. That means it will appear to be as large as it can ever be from Earth. This combination of having all night to observe, and having
a planet that is as big as it can be, is very important. Mars is the best example, because the difference between its appearance at oppostion and conjunction (or what it would be at conjunction!) is staggering.
Mars can appear to be much brighter than Sirius at its brightest - almost becoming as bright as magnitude -3! (as opposed to its dimmest at +1.8). And Mars will appear to be almost eight times larger at opposition
than it is at conjunction.
It is true that to the naked eye, Mars will never appear to be bigger than a point of light in the sky. It is also true that Venus at its dimmest is still brighter than Mars by a good margin. But if viewing Mars is on your list of things to do, it's best to pick times that it is at opposition. And while we have not shown the eccentricity of Mars' orbit, there certainly is one. This means it's also best to pick an opposition that occurs near Mars' perihelion. Oppositions happen about every two years, and the next opposition near perihelion will take place in 2035.
Retrograde Motion
This one is easier to see on the diagram, but here is a description:
Normally, all planets appear to move from West to East across the sky. (This is “right” to “left” in the northern hemisphere, and “left” to “right” in the southern.) The Earth moves faster in its orbit than any outer planet, and so whenever there is an opposition, the Earth has caught up to that planet. As the Earth overtakes and then passes the outer planet, then for a time (as long as a few months!) the planet appears to move backwards against the starry background. Once the Earth has passed it and moved on, the planet will once again appear to travel in the correct direction. It’s kind of like when you ride in a car moving faster than the car beside you, and as you pass it, the other car appears to be moving backwards.
This optical illusion is easily explained by the Copernican model of planets circling the Sun. Before this model was accepted, though, explanations were very difficult. Ancient scientists had to invent all kinds of convoluted theories to try and understand what was happening. You can read about one of these theories, known as “epicycles”, on your own.
What you can learn:
- You can learn the terms for milestone locations in the orbits of the other planets, as seen from Earth.
- You can see how transits happen.
- You can see why Mercury and Venus can never appear to travel more than a certain distance from the Sun in the sky.
- You can learn why it's best to observe the outer planets during "opposition".
- You can learn about retrograde motion, and why it is observed in all the outer planets.
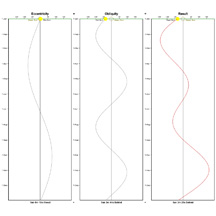
The Equation of Time
An Introduction to the Equation of Time and the Sundial.
See the instructions for Diagram 20Collapse instructions
Diagram 20:
The Equation of Time
What you're looking at:
There are three charts in this diagram. The first two show the main components that make up what astronomers call the “Equation of Time”. The third chart is the result when you put the first two together (but please note, the times shown might not add up perfectly due to roundoff error).
Let’s explain what these charts mean. First, some background:
What is the Equation of Time?
Let’s start by thinking about how you might measure time during the day, using just the Sun.
You can’t see the stars, and you don’t have anything like a pendulum, an hourglass, candles, or water dripping through a tiny hole.
Your phone is out of battery, and you certainly don’t have a backup watch or clock!
The Sundial
You might decide that the easiest way to do this would be to stick a pole in the ground and watch the shadow of the Sun move across the ground as the day progresses.
(It certainly is easier than building a pocket watch!)
Of course, you do have to make sure that the stick is perfectly straight up and down, but you can do that with a plumb bob.
This is one of the oldest methods of timekeeping, and gets us very close to what we’d call “real” time. The stick in the ground casts a shadow which depends on the Sun’s altitude and azimuth – that is, how high it is in the sky, and how far “around” the horizon it is from East to West. As the Sun gets higher in the sky, the shadow of the stick gets shorter. As the Sun moves across the sky from East to West, the shadow appears to move from West to East. Sundials are made so that angle the shadow makes with true North/South will tell you what time it is.
Problems with the Sundial
Of course, the sundial only works during the day, but we can use other methods at night to stay on track.
The next day, we can then re-calibrate everything once we’re able to use the sundial again.
The sundial also has problems if it’s cloudy. Once again, we would have to rely on backup methods in order to run our daily lives. If it’s cloudy a few days in a row, our backup methods might get out of synch with the sundial.
The sundial also has to be calibrated for your latitude and the time of year. The angle that the Sun’s shadow makes on the ground changes with both of these, and so you have to have a known standard to “set” your sundial to.
Solar time also depends greatly on your longitude. At the equator, people who are located east or west of each other by only about 17 miles (28 km) will see their local solar times differ by a full minute! This isn’t a problem if your use of time is limited to an accuracy of, say, “mid-morning” or “late afternoon”. But it’s a mess if you’re trying to set a train schedule that is accurate to the minute. If you need accuracy to the second, you really need a more reliable standard than the Sun.
Even with all these issues, the sundial is still a pretty remarkable invention – being no more than a pole stuck in the ground. It’s a very low-tech way to get surprisingly close to the correct time.
The Sun’s speed isn’t constant
As more accurate standards were compared to the sundial, people noticed that there were errors with the sundial that couldn’t be easily explained.
The Sun’s shadow could be compared against other methods of timekeeping, and it was found that the sundial didn’t measure time evenly from day to day.
Even taking into account all the corrections people could think of, there were certain times of year that the shadow was located ahead or behind
where it was expected to be. The Sun would reach its highest point in the sky a bit earlier or later than it should, and this simply couldn’t be explained.
The error could be almost zero, or it could be as much as a quarter hour early or late. The Sun was reaching local noon at different times every day!
The measurements weren’t a mistake, either – because the exact same pattern happened everywhere the sundial was used. What’s more, the early/late pattern repeated itself over and over, year after year. In mid-February, the Sun was always way behind where it should be. At the start of November, it was way ahead, while in mid-April it was almost perfectly in synch. Very strange!
Of course, there was no way to explain this using math or phyics in ancient times. It was what it was, and so it was simply accepted as the way the universe worked. Because the pattern was repeatable, the ancients dutifully modeled it and included it in their reckoning of time whenever a sundial was used.
The Equation of Time
Today, we call this discrepancy between where the Sun should be and where it actually is, the “Equation of Time”.
(In this instance, the word “Equation” means more that we’re balancing out the Sun being fast or slow,
rather than trying to set two things equal to each other.) And in the modern era, we have the background to be able to understand and explain the phenomenon.
Remember that we’ve learned a couple of things about the Earth’s Orbit; namely, that it has an Obliquity (Diagram 13) and an Eccentricity (Diagram 18).
We need to now consider these two effects separately, so in the discussion that follows, we’re going to consider four different “Suns”:
- A “Mean” Sun (meaning “average” Sun), which is the Sun we expect to have – one that moves at the exact same speed through the sky at every moment of the year,
- The “Ecc” Sun, which is an imaginary Sun that moves against the Mean Sun according to the effects of Eccentricity only,
- The “Obl” Sun, which is also an imaginary Sun that moves against the Mean Sun according to the effects of Obliquity only, and finally,
- A “Real” Sun, which is the actual Sun we see in the sky, and which moves slower or faster than the Mean Sun. It is a combination of the Ecc Sun and the Obl Sun.
This will all make more sense as we explain each of the graphs.
Why do we need all these Suns? Well, we need the Mean Sun to serve as a baseline for the others. We need the Real Sun to talk about the actual Sun we see in the sky. And then, we need “fake” Suns that describe the effects of both Eccentricity and Obliquity of the Earth’s orbit separately from each other. At the end, we will take the Ecc Sun and the Obl Sun and put them together to get the Real Sun.
It’s very important to remember that the Ecc Sun and Obl Suns are not the Real Sun we see in the sky. They are also not the same as each other. The Mean Sun that we will use in all the diagrams is always the same, though.
As we’ve indicated, there are two main factors that make up the Equation of Time:
Eccentricity
We learned in diagram 18 that the Earth’s orbit is elliptical rather than circular.
That means that at certain times of year, the Earth moves faster or slower than at other times.
Because the Sun’s apparent motion through the Zodiac is caused by the Earth’s actual motion in orbit,
that means that we see the Sun seem to slow down and speed up slightly at various times of the year.
It’s true that precession causes those times of year to shift, but only over very long time frames. It’s safe to say that at our current point in history, the Sun appears to move through the sky faster in January than it does in July. This change in speed results in a difference between where we observe the Sun to be, and where it would be if it moved at a constant speed.
We can calculate and graph this difference by setting a Mean Sun as the standard, and plotting how far behind or ahead of it the Ecc Sun is (based only on the effects of Eccentricity of the Earth’s orbit). When we do this, we get the first graph you see in the diagram.
To read this graph, you can set the Day of the Year to any date you like. As you change the date, the Mean Sun will move straight up or down the middle of the graph, while the Ecc Sun moves around it. If the Ecc Sun is to the left of the Mean Sun on a given date, that means that the Ecc Sun is slower than it should be on that day. In other words, actual noon happens before the Real Sun actually gets to its highest point in the sky. If the Ecc Sun is to the right of the Mean Sun, then the Ecc Sun is ahead of where it should be, and noon comes after the Real Sun has culminated for the day.
If the two Suns are at the same point (as they are on about 3 Jan and 5 Jul), then those are the days when everything balances out, and this Eccentricity adjustment doesn’t contribute anything to the Equation of Time.
You can read the caption at the bottom of the graph to see how much ahead or behind the Ecc Sun is on any given date.
(NOTE: If you’re in an advanced math class, you’ll notice that the graph looks like a sine wave, with the period being exactly one year. That’s basically what it is, and if you modeled it with a standard trig equation, you’d be very close to the actual values we observe! The reason the period is one year is because over the course of one year, the Earth moves from a point closest to the Sun [perihelion], to a point farthest from the Sun [aphelion], and then back again – tracing out the outline of a perfect sine wave. This in turn causes its speed to set a pattern of “faster, then slower” one time during the year.)
Obliquity
This one is a little tougher to explain, but the effect is just as important. We know that the Sun doesn’t follow a straight path through the sky over the course of a year.
Its path is curved, so that it is at a high declination in June, and a low declination in December. We saw this illustrated in diagram 13.
(For the discussion that follows, we are ignoring the effect of Eccentricity, in order to focus only on Obliquity.)
The Obliquity of the Earth’s orbit is what causes the Ecliptic to first rise above and then fall below the celestial equator. The Sun is therefore traveling in a curved path that looks like a sine wave. (We flattened out that sine wave for simplicity in diagram 19, but you can clearly see it in diagram 13.) This up and down motion of the Sun causes its declination to change over the course of the year. As we saw in Diagram 1, the Sun can be far North in declination (as in June and July), far South (as in December and January), or right at the equator (at the Vernal and Autumnal Equinoxes). All of this is due to the Obliquity of the Earth’s orbit.
Since the Sun is moving at a constant speed along the curved outline of its path through the stars (which is a sine wave), but the Mean Sun is only traveling the straight line forming the axis of that path (the midline of the sine wave), it makes sense that the Obl Sun will be moving faster horizontally than the Mean Sun when it is at the top and bottom of that sine wave path. These are the two times of year when its motion is most parallel to the straight-line motion of the Obl Sun. Whenever the Sun is moving at an angle to that midline (which also happens twice a year), it will be moving slower horizontally through the sky than the Mean Sun.
[Again for those of you in advanced math or physics classes (because there’s really no “easy” way to describe this), we can say that the component of the Obl Sun’s velocity along the path of the Mean Sun is greatest whenever the Obl Sun’s velocity vector is most parallel to the path of the Mean Sun. These points occur at the max and min of the sine graph that represents the Ecliptic plotted again the celestial equator. That horizontal component of velocity is least at the two times each year when the Sun crosses the equator.]
Regardless of how you say it, what this means is that at two times of the year the Obl Sun is moving faster than the Mean Sun. If we plot the resulting location of the Obl Sun (whether it’s ahead of or behind the Mean Sun), for the entire year, we get the middle chart in the diagram.
Because one year contains two cycles of this slow-fast-slow motion of the Obl Sun, we see that the Obliquity sine wave has two periods over the course of a single year. Again, you could model this graph with a standard trig equation, and come out pretty close to the observed values.
Through all of this, we need to remind you once again: The Obl and Ecc Suns are not the same. Their effects had to be separated and isolated in order to get results as clean as these are.
Result
The Result graph is what we get if we add up the Eccentricity graph and the Obliquity graph for each day of the year.
This represents the “Real” Sun – the one we actually see in the sky.
It’s a weird shape, but it’s nothing more than the combined sum of the two sine waves we saw for Eccentricity and Obliquity.
So for example, on 2 July, we see that the Ecc Sun is 23 seconds behind where it should be. The Obl Sun is 3m 32s behind. That means the total is 3m 55s behind, and the Result graph shows us that roundoff error has made it 3m 56s. So the actual Sun is 3m 56s behind where it would be if the Sun moved at the same speed all the time. Put another way, when the sundial shows the moment of high noon on 2 July, it’s really 12:03:56pm.
We are going to put this Result graph to good use in the next diagram!
Remember, the actual Sun we see in the sky is the Real Sun, and not the Obl Sun or the Ecc Sun. The Real Sun is a combination of the two.
The Sundial revisited
It turns out that if you make a table of how much these two factors contribute to the Real Sun being faster or slower than the Mean Sun,
and add them up, you will get a chart of exactly how much adjustment needs to be made to your sundial’s shadow for each day of the year.
If you do this, and measure carefully enough, then your sundial will be very precise.
If you then make the correct adjustments for longitude and latitude, you could indeed use the sundial to tell time as accurately as
you’d ever need it to be in your day-to-day life.
Controls:
You can always pinch the screen or use the control at left to zoom in and out of the diagram, and your left and right mouse buttons to move and rotate the whole diagram.
Day of the Year
This control moves us through each day of the year. You can use the slider control or your right and left arrow keys to change the date.
As you move the slider, the Real and Mean Suns will move through the charts and trace out the components of the Equation of Time.
Please note that as the Sun moves down each chart, it is moving forward in time.
Day of Year Speed
A version of this "speed" slider is present in almost all the diagrams, and allows you to move the objects in the diagram at varying speeds.
Click and hold the slider control, and the more you drag it to the right, the faster things will move. Release it to
have it snap back to the left and stop the motion.
This slider controls the Day of the Year. It moves the Real and Mean Suns through the days of the year, which causes them to trace out the components of the Equation of Time.
Things to Notice
You’ll see that there are four times of year when the Mean and Real Suns are almost in the same place on the Result graph.
This means that on those days, there is no Equation of Time adjustment, and your sundial will indeed show the correct local solar time.
You’ll also notice that the Result graph has two big swings away from the Mean Sun midline, and two little swings away from it. If you look closely, you’ll see that the big swing to the right in November is bigger than the big swing to the left in February. You’ll also see that the little swing to the right in May is smaller than the little swing to the left in July/August. These facts will be of interest to us in the next diagram.
Something Extra
For those of you who have a musical background, you’ll notice that the Result graph is starting to look like what you might see in an oscilloscope
when a musical sound is being played. Every musical tone has a distinctive wave pattern, which we hear as different types of sound quality
(called “timbres”) which allow us to identify different musical instruments playing the same pitch. These wave patterns can be very simple or very complicated,
but they all result from adding up combinations of component frequencies such as the Eccentricity and Obliquity graphs.
When you hear a very pleasing musical tone, you can be sure that many frequencies are being added together to make its resulting wave pattern. If all you had to look at was that resulting pattern, it might seem impossible to be able to determine all the component waves that went together to make it up. In fact, it is very difficult, but it’s not impossible! Thanks to the work of a mathematician named Joseph Fourier, we can decompose any complicated periodic wave pattern into its component sine waves, and see just how the different pieces fit together to make the sounds of the different instruments we know. This is in fact how computer samples for electronic music are made.
It’s truly amazing that we can observe patterns that apply to subjects as different as astronomy and music, and analyze them both using the same mathematics!
What you can learn:
- You can see why you have to adjust the time you see on a sundial, in order to get the correct local time – except for four days out of the year!
- You can see how the Equation of Time results naturally from the Earth’s orbital motions.
- You can see a simple example of how several effects can add together to create a result.
- You can see a real-life example of the use of the sine wave graphs you learn about in Trig class!
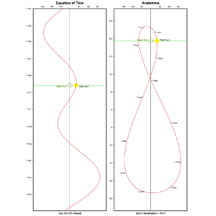
The Analemma
The apparent annual path of the Sun in the Sky.
See the instructions for Diagram 21Collapse instructions
Diagram 21:
The Analemma
What you're looking at:
We only have two charts in this diagram. First, we’ve copied the “Result” graph from Diagram 20 and put it on the left as a reference. We’ve added a graph on the right that shows the same data, but in a different way. You’ll see how we did it in just a bit.
The Equation of Time Graph – Two different ways
We’ve already seen how to derive the Equation of Time graph.
In Diagram 20, we put the days of the year on the y axis, then we took the amount of time the Sun was “ahead” or “behind” the sundial and put that on the x axis.
We know that the Sun’s Declination moves throughout the year, and it moves between +23.5° and -23.5° because that’s how much the Earth tilts on its axis. As it turns out, it’s interesting to plot the Equation of Time, not as an x-y graph, but as a parametric graph.
What’s a parametric graph?
If you haven’t studied this in school yet, you can think of any parametric graph (for our purposes in this discussion) as a figure that you draw on a piece
of paper without lifting your pencil off the paper. You can use straight lines or curves however you want, and you can make it as complicated as you want –
with loops all over the place. But you have to end up where you started so that it’s a continuous path with no breaks in it.
You’re also allowed to speed up or slow down your pencil as much as you want while you’re drawing your graph. That means that two people could wind up drawing the exact same figure, but because one person went slower here and faster there than the other person, then technically the parametric graphs are different – even though the path they trace out is exactly the same!
If you think of a bug walking along the path you create, then that bug might crawl really fast on one part of the curve, then slow down to take a rest, then sprint to the finish. What matters is that the bug crawled along the path we want, and that we’re able to tell how fast the bug was crawling at every point.
What’s that got to do with the Sun?
Now, look at the graph on the right of the diagram. The x-axis still represents minutes, and it shows how far ahead or behind the Sun is relative to the sundial (just like before).
But now, the y-axis is the Sun’s declination instead of the date. Up at the top of the graph, the Sun is high in the sky for the Northern Hemisphere,
and at the bottom of the graph it’s high in the sky for the Southern Hemisphere.
Right in the middle, it’s over the equator with a declination of 0°.
You’ll also notice that we put some tick marks on the graph to show the start of every month of the year. This is the parametric part of the graph, where we are showing how fast the Sun is moving along the curve at every point. There’s a lot more distance along the path between October and November than there is between July and August. That’s because the Sun is moving slower through the sky in July than in October – which of course, is because the Earth itself is moving slower in its orbit in July! It all fits together.
What is this graph showing us?
If you move the Day of the Year slider now, you’ll see the Equation of Time graph doing the same thing it did in Diagram 20.
But the graph on the right will show the Sun going around this figure-8 in a big loop, just like the bug we talked about earlier, following the path over and over again.
What the graph is showing you is exactly where the Sun is in the sky, for each day of the year, exactly at noon on your local clock. We’re not talking about noon local solar time, but noon local mean time, because the graph is already taking into account how far ahead or behind the Sun is.
Said another way, if your modern clock says it’s noon, and you plot where the Sun is in the sky at that moment, it would be in the same spot relative to due North-South as this graph shows.
That’s really important, so we’ll say it again: The graph is not only showing you how far ahead or behind the Sun is, but it’s also showing you how high in the sky it will be. That’s something the old Equation of Time graph wasn’t showing us at all!
The Analemma
We’ve spent a lot of time talking about this graph on the right, so we’ll give it a name – it’s called an “Analemma”. That word has a difficult etymology,
but it originally comes from a root word meaning “support” –
as in, the support or base of a sundial! After all, keeping time with a sundial is one of the main reasons for the analemma to exist in the first place, so that kind of makes sense.
There are some other words that sound similar to “analemma”. There are the mathematical terms “lemniscate” (kind of a figure-8 graph), and “lemma” (a minor theorem used to prove something else, like we’re doing here). There’s also “dilemma”, which is what happens whenever you have two things trying to be true at the same time – like the Sun and the sundial. There’s even a similarity between the analemma shape and the infinity symbol – but unfortunately, that one’s nothing more than simply a nice coincidence!
Controls:
Day of the Year
This control moves us through each day of the year. You can use the slider control or your right and left arrow keys to change the date.
As you move the slider, the Suns will move through the charts and trace out the Equation of Time and the Analemma.
Day of Year Speed
A version of this "speed" slider is present in almost all the diagrams, and allows you to move the objects in the diagram at varying speeds.
Click and hold the slider control, and the more you drag it to the right, the faster things will move. Release it to
have it snap back to the left and stop the motion.
This slider controls the Day of the Year. It moves all the Suns through the days of the year, which causes them to trace out the two graphs.
What’s Next?
Since the analemma shows where the Sun actually is in the sky for each day, some people have taken this as a challenge to photograph the Sun every day for a year,
just to see if that’s really the case! We’ll talk a lot more about this in Diagram 22, where we show you what the analemma looks like from any point on Earth!
What you can learn:
- You can see how the Equation of Time turns into the analemma if we use a different means of graphing it.
- You can see how changing the way we graph something can make it even more useful.
- You’ve had an introduction to parametric graphs.
- You can see what that weird figure-8 shape is that they stuck in the Pacific Ocean on every globe you’ve ever seen. (Now you know what it is!)
- You can see how we know where the Sun is going to be located in the sky at any time, on any day.
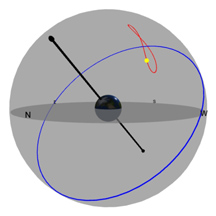
The Analemma in the Sky
See the analemma from everywhere on Earth, at any time of day!
See the instructions for Diagram 22Collapse instructions
Diagram 22:
The Analemma in the Sky
What you're looking at:
We've used the same sphere as in the early diagrams. You'll see the Earth with its poles, the horizon and the blue circle representing the celestial equator. You also have the little green observer, who can be positioned anywhere on Earth!
But now, we've put the Analemma in the sky instead of the Sun, Moon, or stars. Remember, the Analemma represents the positions of the Sun at a given time, each day for an entire year. You can move the Sun along the outline of the Analemma to see where it is in the sky at that time on any given day.
You can also change the time of day. This lets you see the position of the Sun early in the morning or late in the evening. You can see when the Sun will rise or set (but see below for a more detailed explanation!). You can also see how the Analemma looks very different from different latitudes on Earth.
Remember, the Analemma is a representation of the "Equation of Time" - which tells us how much earlier or later the actual Sun is positioned in the sky, vs. an "average" Sun that moves at the same speed all the time.
Controls:
You can always pinch the screen or use the control at left to zoom in and out of the diagram, and your left and right mouse buttons to move and rotate the whole diagram.
Show Observer
If you check the checkbox, you’ll see a little green observer standing on top of the Earth.
The horizon we’ve drawn with the gray disk and the blue circle are the horizon this observer would see. Uncheck the box to hide the observer.
Reset Horizon
It's not always easy to get the view exactly the way you want it. Use this button to get the horizon level again!
Rotate the Earth
You can spin the Earth to put the observer right on your location. This will show you the objects in the sky exactly as they appear from where you are.
The label on this slider at the right is the observer’s longitude.
Latitude
As in the earlier diagrams, this positions you somewhere on Earth at a given latitude. You'll see the Analemma move as your position on Earth changes.
Day of Year Speed
A version of this "speed" slider is present in almost all the diagrams, and allows you to move the objects in the diagram at varying speeds. Click and hold the slider control, and the more you drag it to the right, the faster things will move. Release it to
have it snap back to the left and stop the motion.
This slider controls the motion of the Sun along the outline of the Analemma, for the location and time of day you've set with the other sliders.
Day of the Year
Change the date to move the Sun along the outline of the Analemma.
Time of Day
This slider lets you move the Analemma to see the position of the Sun at any given time.
NOTE: This slider is showing Local Solar Time
It's VERY important to remember that the time you see on the slider is generally not the time you'll see on your clock. It's corrected for the
Equation of Time, of course, because that's what the Analemma is based on. But it's not corrected for things like your position within your local time zone (longitude), your altitude, atmospheric refraction, or Daylight Saving Time.
These can affect the time you see on the slider by almost two hours!
It's best to think of the slider as displaying "Local Solar" time, showing local sunrise, sunset and noon as relative values rather than exact clock times. If you need more precise calculations to get the actual times of sunrise and sunset for a given location, many online tools exist for that purpose.
We've made it so you will always be able to place a part of the Analemma above the horizon, no matter what latitude you select. For places like the poles, you'll see that the Analemma never fully sets, because there are times of the year where the Sun never sets. In these locations, you're free to choose any time of day you like - even midnight! But for the lower latitudes, when there are times of day where the Sun never gets above the horizon no matter what day it is, we've limited the time slider accordingly. It doesn't make much sense to view an Analemma that you could never see in the real sky!
Sunrise and Sunset
There is one interesting feature of the Analemma that we should describe for you. Because the Sun has to take a position somewhere along the Analemma's outline for a given latitude and time of day, the Analemma really represents all the valid
locations of the Sun for that particular time over the course of the year. This can help you find the date of earliest or latest sunrise or sunset for a given location. To try this, first set the time slider to a time near sunrise
or sunset, where a very small piece of the Analemma just barely touches the horizon. You can do this in the east or west, and you can have the Analemma completely below the horizon, or completely above it - just make sure it is barely touching the
horizon. Once you have it how you want, you can then adjust the date slider until the Sun is right at that point on the horizon.
Let's say you chose the eastern sky to place the Analemma in, and you put the Analemma so it was above the horizon, just barely touching it. That arrangement is going to give you the time of the latest sunrise that that location can ever see. Now you can move the date slider to the day when the Sun is at that same point on the Analemma, just touching the horizon. That will be the date of latest sunrise. The time will be solar time, of course, but you'll be able to see the approximate location of sunrise as well as the date.
You can also use the Analemma to find the date of farthest northern or southern sunrise/sunset for a certain location. To do this, just place the Analemma so that some part of it is touching the horizon as far north or south as it can get for that latitude. Then move the date slider again to put the Sun in that exact spot on the horizon, and you'll have the date you're looking for!
Maybe you can think of other uses for the Analemma: When will the Sun rise and set exactly in the East or West for your latitude? What day(s) will it rise exactly at 6am at the equator? What dates will the Sun never rise for latitude 78° South? Just remember, for any discoveries you make that involve a time, that time will be uncorrected for the factors we described above. If you're doing "earliest", "latest", or most northerly/southerly events, then those will be a lot more accurate.
Photographing the Analemma
Many great photographs (and even videos!) of the Analemma exist online. These are very difficult to capture, because it involves having a camera permanently set up to take a picture at the same time of day, every day for a year! The camera has to be
protected from the weather, and it cannot move at all for an entire year. If you want to give it a try, make sure to pick a time of day where the Sun will be above the horizon every day -
and a location where it won't be blocked by a tree or building at that time during any part of the year. And remember that many years ago, when photographs couldn't be combined digitally, photographers had to choose their exposure so
that they could take their daily photo on the same piece of film. They also couldn't see any result at all until after the whole year had passed! This was an astounding feat, that only a very few people could pull off.
Still, it's a neat experiment, which you might want to try yourself!
What you can learn:
- You can see how the Analemma appears for any latitude on Earth, and for any time of day that the Sun is visible.
- You can see how to find the time of latest or earliest sunrise or sunset for a given location.
- You can see how to find the time of most northerly or southerly sunrise or sunset for a given location.
- You can see how the equation of time affects the position of the Sun in the sky.
- You can see the difference between your local time and Solar Time.
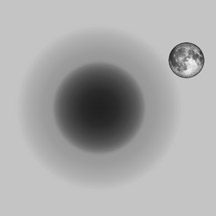
Create Your Own Lunar Eclipse!
Here is a way to visualize what a lunar eclipse looks like from Earth.
See the instructions for Diagram 23Collapse instructions
Diagram 23:
Create Your Own Lunar Eclipse!
What you're looking at:
We’ve set up everything you need to create a lunar eclipse! You’re standing on Earth, looking up at the sky at night, and the Moon is at the right of the diagram. As time moves on, it will move in its orbital path around the Earth, and that will cause it to appear to move from right to left across the diagram.
The Moon is full, which means that the Sun is lighting it completely. The Sun is behind you, making it daytime on the other side of the Earth. The Sun shining on the Earth causes the Earth’s shadow to be projected out into space, into your night sky. You normally can’t see that shadow until the Moon moves into it, but in this diagram you’ll be able to see it very clearly!
That shadow has two parts: an “umbra” which is the dark central part of the shadow, and a “penumbra”, which is a very faint part of the shadow that surrounds the umbra. You can only see those if you “turn off” the sky by using the “Sky” dropdown. This will turn the sky from black to a light gray, but the Earth’s shadow will stay in place for you to see.
You can also change the distance from the Earth to the Moon, and from the Earth to the Sun. We’ve given you a control which allows you to change these distances within the actual range we see in real life. Each of these distances changes the relative sizes of the umbra, penumbra, and Moon slightly, based on the geometry of the situation you set up.
You can also change the angle the Moon’s path takes, and how far “up” or “down” that path is compared to the ecliptic. Here’s an explanation:
The Moon’s orbit is inclined about 5.1° from the ecliptic, and the Moon’s declination can either be increasing or decreasing at the node of its orbit. We’ve given you a control to specify whether you’d like the eclipse to be happening at the Moon’s Ascending or Descending Node.
And remember from diagram 9 that the Moon has to be near a node of its orbit in order for an eclipse to happen – but it doesn’t have to be exactly at a node! Because the Moon and Sun can be located several degrees before or after their actual nodes during an eclipse, that means the Moon’s actual path can be higher or lower than a path straight through the center of the umbra. We’ve given you the ability to simulate this by moving the Moon up and down. Just remember that what you’re really doing is moving the Moon either earlier or later in its orbit, relative to the node.
Controls:
You can always pinch the screen or use the control at left to zoom in and out of the diagram, and your left and right mouse buttons to move and rotate the whole diagram.
Node
Use this control to set which node the Moon is at – that is, whether the Moon’s declination is increasing or decreasing.
Sky
This control lets you see the Earth’s shadow. If you set the sky to “Black”, things will look like they do in real life,
and you won’t be able to see that shadow unless the Moon is inside it. But if you set the dropdown to “Gray”, then you’ll essentially "turn off" the sky!
You’ll be able to see the Earth’s shadow projected out into space, ready for the Moon to pass through it.
The Earth’s shadow has two parts. The dark circle on the inside is the “umbra”, which is where all the Sun’s light is blocked out and a lunar eclipse would be total. The light gray ring around the umbra is the “penumbra”, which is where the Sun’s light is only partially blocked. If the Moon goes into the penumbra region of the shadow, it darkens slightly – but not much.
You might read or hear about the term “penumbral lunar eclipse”. That’s when the Moon only passes through the penumbra, and misses the umbra entirely. If you were looking right at the Moon and didn’t know there was a penumbral eclipse going on, you might not even notice it!
Hemisphere
The diagram defaults to show things as they appear in the Northern Hemisphere. If you select “Southern Hemisphere” in this dropdown, things will flip over so they will be correct as you see them in your sky! The Moon will move from left to right, and will appear in its correct orientation.
Sun Distance
The Sun is behind you in this diagram, and you can’t see it – but it is providing the shadow of the Earth that you can see.
Use this control to change the distance from the Earth to the Sun, which will change the shadow sizes slightly. The change in size is very subtle, but it’s there!
Moon Distance
You’ll notice a marked change in the Moon’s size as you adjust its distance.
(This is something you don’t notice in real life unless you have astronomical measuring equipment – or unless you’ve heard there’s going to be a “Supermoon”.
Sorry to disappoint, but that’s really nothing more than a Moon that’s larger than average.)
You’ll also notice that the penumbra changes size. The reason for this is that we had to keep something constant as the Moon’s distance changes. Because it’s important to actually see the Moon’s size change, we needed to keep the size of the umbra the same. Because the shadows are drawn at the distance of the Moon, that means the penumbra is getting bigger as the Moon moves farther away. (The umbra is actually getting smaller in real life as the Moon gets farther away, but if we showed that, then you wouldn’t see the Moon change size.)
Moon Position
Remember, the Moon has to be at one of its nodes for an eclipse to occur – but it doesn’t have to be exactly at the node!
It can be a few degrees on either side of the node.
That means that the Moon can appear to be higher or lower than the ecliptic, and this control helps you model that.
If you move the Moon up or down using this control, you’re really positioning it earlier or later than the node. This means that the Moon can miss the shadow completely (which is what usually happens). Or, it can pass only through the penumbra, or partially through the umbra. It all depends on where you place it!
Using this control, you can set up all four types of lunar eclipse:
- Partial Penumbral eclipse:
- The Moon will only partially touch the penumbra. This type of eclipse is almost impossible to observe, because the Moon doesn’t darken very much at all.
- Penumbral eclipse:
- The Moon becomes completely covered by the penumbra. You might notice some darkening, but again, this type of eclipse is hard to observe.
- Partial eclipse:
- The Moon becomes partially covered by the umbra. This is very noticeable, because the part of the Moon that enters the umbra can become very dark. It’s a huge contrast to the part of the Moon that’s only in the penumbra.
- Total eclipse:
- The Moon will be completely submerged in the umbra, and will darken significantly. This is a beautiful eclipse to watch!
The label on the right of this control tells you how many lunar radii you have moved the Moon up or down from the ecliptic.
Path
This control moves the Moon in its path through (or past) the shadow. Again, the control tells you how many lunar radii the Moon is removed from the
center point of the umbra, along the length of its path. You can use the right and left arrow keys to move the Moon as well, in order to get a nice smooth motion.
Each click of your arrow key represents a little more than 30 seconds of motion in real life.
This shows you the leisurely pace all lunar eclipses take!
We need to point out to you that the Moon is moving from right to left as you move the Path control forward in time. This is because the Moon is on the opposite side of the Earth from the Sun, and so it is indeed moving in its orbit from West to East (“right” to “left” in the Northern Hemisphere). During a lunar eclipse, the Earth’s shadow basically stays put in the sky, and the Moon moves through it. That’s right – during a lunar eclipse, the motion of the Moon that you see is not due to the Earth’s rotation, but to the Moon’s own movement in its orbit around the Earth!
How dark does the Moon get?
You’ll notice that whenever any part of the Moon enters the umbra, it takes on a kind of dull reddish tinge.
In real life, this coloring can be anything from a light red to deep, dark red – almost approaching a “light black”. In extreme cases, the Moon can almost seem to disappear completely – though that is rare. In this diagram, we’ve chosen to represent totality using a reasonably standard model of how dark lunar eclipses actually get. Just remember though – every one is slightly different!
Astronomers use a visual method for describing how dark a total lunar eclipse gets, basically by eyeballing it and comparing with surrounding stars, or their own experience, to describe it to others. The scale they use is called the “Danjon” scale, and it uses numbers from 0 through 4 (with 0 being the darkest).
Photographs of lunar eclipses almost always appear to be nice and bright red or orange, because the photographer has taken a very long exposure to make the Moon appear brighter than it does in the sky. This longer exposure allows brighter stars to be captured as well, and makes for a very nice lunar portrait.
Why are some eclipses darker than others? And why does the Moon take on a color when it enters the umbra? Well, the darkness has to do with the size of the umbra, and how far into it the Moon gets. It’s pretty rare for the Moon to pass exactly through the center of the umbra, and so during some eclipses it isn’t passing through the deepest, darkest part of the shadow.
The eclipsed Moon appears to be a rust, or orange, or red color, because the Earth’s atmosphere scatters the Sun’s light. The Sun’s light is being blocked by the Earth, but the air around the edges of the Earth “bends” some of the Sun’s light around. Some of that light makes its way into the umbra, and depending on how much dust, smoke, volcanic ash, or clouds happen to be located on those parts of the Earth, more or less light will be scattered by the atmosphere there.
The Earth’s atmosphere is scattering this light at places that are always located where the Sun (as you’d see it from those points on Earth) is right at the horizon. Because this light scattering is the same thing that causes sunrises and sunsets to be red, astronomers are keen to point out that the orange-red color you see on the Moon during totality is the cumulative effect of every sunrise and sunset on Earth happening all at once!
What you can learn:
- You can see how the Earth’s shadow has two different parts – the umbra and the penumbra.
- You can see how the Moon moves through the Earth’s shadow during a lunar eclipse.
- You can see that a lunar eclipse gives you the chance to observe the Moon moving in its orbit.
- You can learn about the different types of lunar eclipse.
- You can learn why the Moon takes on a red or orange color during a total eclipse.
- You can learn why total lunar eclipses happen at a very nice, slow pace – as opposed to a total solar eclipse!
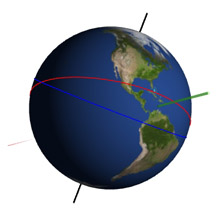
Create Your Own Solar Eclipse!
This diagram shows Bessel’s method for predicting solar eclipses, and allows you to set up your own eclipse.
It is strongly recommended that you read the instructions first!
See the instructions for Diagram 24Collapse instructions
Diagram 24:
Create Your Own Solar Eclipse!
What you're looking at:
This is perhaps the most complicated diagram of all – and it’s got a lot to show you!
When the diagram loads, you’re looking at a flat plate with a circle on it. The dark circle is a “flattened” Earth, and you can see the black equator and the north-south pole on it. You can click and drag this flat plate around to rotate it.
You’ll also see a red and green shape that looks like a line – but it’s really a very long, thin cone. If you zoom in and rotate the diagram, you’ll see that it’s actually two cones, with their tips together and pointing in opposite directions. This double cone is the shadow of the Moon, which is behind you and off to the right as the diagram loads. This shadow is going to move over this model of the flat Earth, and that is going to cause people to see an eclipse!
This flat plane is a cross section of the Earth, drawn through the north and south poles, and the Earth’s center. The Moon is behind you. The Sun is even farther behind you than the Moon is, and so it’s causing the Moon’s shadow to be cast perpendicularly onto this flat Earth. That means that the Moon’s shadow will always hit this “Earth” at a 90° angle.
That means that no matter how things are arranged, the part of the shadow that intersects this flat Earth is always going to be a perfect circle – and that makes all the calculations much easier!
(Note: The circle isn’t perfect, because there are mountains and valleys on the edge of the Moon that cause jagged edges in the outline of its shadow. But for the purposes of this diagram, we’ll assume the circle is perfectly round!)
This "flat Earth" model is exactly the scenario that an astronomer and mathematician named Friedrich Bessel invented when he created his method for predicting eclipses back in the early 1800s. It’s a brilliant simplification, because it allows us to calculate the size and shape of the shadow, as well as its movement over the flat earth, using nothing more than elementary geometry and trig.
We have omitted one very important detail from Bessel’s fundamental plane, which has allowed us to be able to show something very important to the discussion. Bessel’s plane moves in space so that its north and south poles always lined up with the Earth’s. This is absolutely required if we want to do the detailed eclipse calculations that the model allows. In our plane, we are allowing the Earth to move around just as it moves through its orbit – but we’re keeping the plane fixed in the position where its poles are aligned with the Earth’s only on the Summer and Winter Solstices. This will let us show you VERY clearly that in creating solar eclipses, the Moon is never moving in any way other than its orbit – which is inclined up or down 5.1° from the ecliptic.
The Moon’s Shadow
There are two parts to the Moon’s shadow – the red part and the green part. We’ll need another diagram to show you why this is,
and we’ll use a classic drawing like you always see whenever eclipses are being explained. Please keep in mind that this drawing is not to scale; the cone we're showing
below is really very long and thin - like in the main diagram!

(Courtesy www.wpclipart.com)
You’ll notice that the Moon's shadow has been drawn as a triangle. In real, three-dimensional space that triangle will actually be a cone. From the Moon to the tip of that cone, that’s the actual shadow of the Moon. It’s called the "umbra". If you’re within that region of the shadow, the Sun will be completely blocked out. Everything is very well labeled on the picture above, and we've colored this part of the shadow green in our diagram.
If you extend those lines that form the sides of the green cone, they make another backwards cone that continues on out through space. That’s the "antumbra", and if you’re within that region of the cone, then the Moon would appear to be covering the Sun, but it wouldn’t be large enough to cover it completely. This means you’d see a ring of Sun around the edge of the Moon – an "annular" eclipse. We’ve colored this part of the shadow cone red in our diagram.
(Please note that "annular" doesn’t mean "annual"! The two words are very different, and “annular” comes from the Latin word meaning "ring". “Annual” means that something happens every year, and that’s not the case here.)
Let’s say you were located on the flat Earth, and this shadow passed over you. If you were in the green part of the cone, you’d see a total solar eclipse. If you were in the red part, you’d see an annular eclipse. So far, so good.
But when the diagram loads, it looks like no matter where you’re located, you’re always going to be inside the green part of the cone! How can the red part ever touch the flat Earth? Patience… We’ll get there!
Once you start using the controls, you’ll see that you can position this cone anywhere you like – up, down, right or left. You’ll also be able to move it over the flat Earth, like the Moon is moving in its orbit and the eclipse is taking place. But you’ll also be able to change the distances between the Earth and the Moon, and the Earth and the Sun! If you do that, then you’ll see the shape of the shadow cone change, and there will be configurations you can set up which will allow you to make the red part of the cone hit the flat earth.
You might want to zoom into the diagram, to be able to see the round outline of the Moon’s shadow on the flat earth. You’ll see that it’s a circle – though not a very large one!
The Penumbra
We also have a checkbox called “Show Penumbra”. If you turn this on, you’ll see the outer part of the Moon’s shadow, where the Sun is only partially blocked out.
It looks like a cylinder, but it’s really the end part of a very long, gently sloping cone. If you’re on the flat Earth, and this penumbra part of the shadow passes
over you, then you’ll see a partial solar eclipse – regardless of whether the red or green part of the shadow is in play for the distances you’ve set!
But the Earth isn’t really flat!
This flat Earth might be great to use to visualize all this, but we know that the Earth isn’t really flat. We just imagined it to be so we could simplify the picture –
and the math! But when you change the Mode in the dropdown we’ve given you, then things will start to get interesting.
If you make the mode “3D”, then the flat earth will turn into a round Earth – but the Moon’s shadow will still be right where it was. Now, if you zoom in, you’ll see that depending on where the shadow is located, the intersection of the round Earth and the cone-shaped shadow is really complicated. It’s kind of an oval, but it can be more circular if the shadow is near the “middle” of the Earth. It can become very weird-shaped if the shadow is near the edge of the Earth. But the important thing to remember is that it’s still the very same shadow we saw before! The shadow isn’t changing shape, but when we project it up from the “flat Earth” plane to the real "round Earth", that intersection shape becomes very much non-circular. The math we’d have to use to describe it would be very complicated, and this is why it’s much easier to start out by imagining that perfect circle outline on the flat Earth.
By the way, it’s still true that anyone located inside the green part of the Moon’s shadow will see a total eclipse, and anyone in the red part of the shadow will see an annular eclipse. It’s just that now, we have an idea of exactly where on Earth they need to be standing to see the eclipse.
If you have the penumbra turned on, you’ll also see its outline on the Earth’s surface. Anyone inside that very large region will see a partial eclipse. Again (and this is really important to remember), everyone out in that outlying penumbral region of the shadow will see a partial eclipse, regardless of whether the people inside the red or green shadow are seeing a total or an annular eclipse. In fact, if you didn’t tell the people in the penumbra what kind of eclipse was going on in the center of that shadow, they’d have no way of knowing.
In the Mode dropdown, you’ll also see "3D + Hide". This setting is to allow you to hide the part of the shadows that are on the back side of the flat Earth. There are situations that come up where it’s easier to see what’s going on if you have this setting in place.
You also have controls to "pan" the diagram, or move it up, down, left, or right. This is convenient whenever you’re zoomed in really far, and the part of the Earth you want to see has fallen off the edge of the diagram.
Finally, we have controls to allow you to specify whether the eclipse is happening at the Ascending or Descending Node of the Moon, and tilting the Earth correctly based on the day of the year. The tilt is important, because depending on what part of the year it happens to be, the Earth can be tilted in any direction relative to the Moon’s path.
Moon and Sun Distances
Just like in the last diagram, you can change the distances from the Earth to the Moon and the Sun, and you’ll see the shapes of the shadows all change.
What you’ll notice is that the Sun’s distance has some effect on the relative lengths of the red and green parts of the shadow,
but the Moon’s distance has a greater impact on these by far.
Eclipse Types
On the flat Earth, things are simple. Based on the distances you’ve set for the Sun and the Moon, either the red part or the green part of the Moon’s shadow will create the eclipse on “Earth”.
If it’s red, then an annular eclipse will be visible in that part of the shadow. If green, then the eclipse will be total.
When you go to a round Earth, though – things get complicated. Many times it’s the case that whatever eclipse type we have on the flat Earth, we’ll have that same eclipse on the round Earth. But it certainly doesn't have to be!
If you set up an annular eclipse on the flat Earth, and then go to a 3D Earth, you’ll see that the eclipse on the round Earth will always be annular. Likewise, if you set up a total eclipse on the flat Earth, it’s usually the case that the eclipse on the 3D Earth will also be total.
But it's also possible to set things up so that the tip of the shadow cone isn’t very high above the flat Earth. In that case, it can happen that the eclipse on the 3D Earth is annular at the start and end of the path, but becomes total in the middle! This type of eclipse is called “annular-total”, and because of the special circumstances that are required, it’s reasonably rare. You can set one up by setting the Moon and Sun distance so that the shadow cone tip is just above the flat Earth – as we just desribed.
We’ve put a label above the label for the Sun’s distance, that tells you what kind of eclipse you’ve set up. Normally you’ll see that the eclipse is either "Annular" or "Total". But if you’ve set up the situation we described above, then the eclipse will be shown as "Annular-Total", and that means that it’ll start out annular, change to total, and go back to annular again.
Just to note, it is possible in real life for things to be set just right, so that the annular portion of an Annular-Total eclipse is eliminated on one end of the path or the other. This is not possible in our diagram, and we’ll give you more detail about that below.
Controls:
You can always pinch the screen or use the control at left to zoom in and out of the diagram, and your left and right mouse buttons to move and rotate the whole diagram.
Select Preset Eclipse
By popular demand, we have pre-programmed many actual eclipses into this simulator, to show you just how accurate this simple geometry can be. In the top left, you’ll see a button that says “Select Preset Eclipse”. If you click this button, you’ll see a list of eclipses on the right. Move your mouse over any of the dates to see information about that eclipse. Click on the date to load the saved data into the simulation. Then, you can view things just like if you’d created the eclipse yourself! Nothing has been added to the simulation – we’ve just loaded the values into the controls to allow you to see an actual past or future eclipse!
We need to caution you that this diagram is an educational tool, and NOT a rigorous eclipse prediction tool. The paths you’ll see displayed for these preset eclipses are very close to the real path (and actually, they are surprisingly accurate!), but they are not perfect. They cannot be perfect, because we haven’t built all the correction factors into the math that would be used if we were doing rigorous calculations. We’ll explain some of those details below, but please just remember that, especially at the begin and end of the path, the shadow may be off by just a bit.
Reset Ecliptic
This control will level the ecliptic. That’s the red line going across the Earth, which shows the Sun's path over the course of a year.
Reset Equator
This control will level the equator. That’s the blue line going across the middle of the Earth.
Center Daylight
This button puts the Sun directly behind you, so that you’re looking at the part of the Earth’s surface that is all in daylight.
This can help you orient yourself in case you want to see what’s happening in the middle of the eclipse.
When you hit this button, you might think the Moon's shadow has suddenly disappeared. Because you’ve lined yourself up perfectly with the Sun and the Moon, you’ll find (if you zoom in) that you’re looking right down the middle of the shadow! This makes it look like a circle. Just rotate the diagram a little by dragging it with your mouse, and you’ll see the sides of the shadow again!
Node
This control sets whether the Moon is moving “up” or “down” at its standard 5.1° angle relative to the ecliptic.
Mode
This control lets you show the eclipse happening on either a flat or round Earth.
"3D + Hide" mode allows you to hide the part of the Moon’s shadow that is on the back side of the flat Earth. This is extremely useful for showing
where the eclipse path starts or ends due to local sunrise or sunset.
Show Penumbra
Sometimes you only want to see the umbra or antumbra – the part of the Moon’s shadow that is the main player in the eclipse game. In that case, turn off the penumbra using this checkbox.
If you want to show where the solar eclipse is partial, then you can turn it on.
Earth Rotation
This checkbox is only active if you’ve got "Mode" set to display a round Earth. If you turn it on, then the Earth will spin at the correct rate whenever
you use the “Path” control to move the Moon’s shadow. If you turn it off, you’ll only see the Moon’s shadow move.
This can help you visualize the changing eclipse without the distraction of seeing the Earth rotate in the background.
Hide Controls
When you are zoomed in really far, some of the controls get in the way.
This checkbox cuts down the number of controls to just the bare minimum, allowing you to zoom and move the view around,
without having so many sliders in the way.
Uncheck it to bring them back – which will allow you to change the settings and create your own eclipse!
Sun Distance
The Sun shines on the Moon, which then casts its shadow on the Earth. The shape of that shadow varies, depending on the exact distances to the Sun and Moon.
Because this shadow determines the duration and type of the eclipse, these distances are important!
This control allows you to set the distance from the Sun to the Earth, changing the shape of the Moon’s shadow in the process.
Moon Distance
The Moon’s distance has a huge impact on the size and shape of its shadow.
If you take a side view of the diagram, and move the Moon’s distance from one extreme to the other,
you’ll see just how much of a difference it makes in the shadow!
Play with these two distances to get a feel for how they impact the shape of the shadow – and the type of eclipse the Earth will see. You’ll be able to clearly see how little margin there is in between the settings required for a total eclipse vs. an annular.
Moon Position
This control moves the Moon "up" or "down" relative to the ecliptic. Remember from Diagram 23 that eclipses don’t have to happen when the Moon is exactly at a node –
it can be several degrees on one side of the node or the other. This control simulates the situation by moving the Moon farther away from the ecliptic,
which causes the Moon to move on a path that is as far from the Earth’s center as you like.
The label at the right of the slider is how far you’ve moved the Moon’s shadow, expressed in terms of the Earth’s radius.
Day of the Year
The Earth has a fixed tilt of 23.4° relative to the ecliptic.
But because the Earth always points to the same direction in the sky, that tilt presents itself to the Sun as changing over the course of the year.
It’s the same thing that causes the Sun to change declination from one month to the next. Because eclipses can happen at any time of year,
the Sun might see the Earth as tilted one way, or the other way, or not at all, during the eclipse. This control lets you model that.
Move the control all the way to the right or left to get an eclipse happening in June. Put the control in the middle to simulate an eclipse happening in January. Or, put it anywhere in between!
Rotate the Earth
You can rotate the Earth to any orientation you want, to simulate the eclipse happening anywhere on Earth.
If you’ve got "Earth Rotation" turned on, then the Earth will spin from that point as you move the Moon’s shadow.
Pan
If you’re zoomed way in, there might be things going on at the edes of the Earth that have made their way off the screen.
Use these controls to adjust things so you can see them.
This control does not reset any of the movements of the Moon or Earth – it only changes your view of things.
Path
This control allows you to move the Moon’s shadow from left to right, across the face of the round or flat Earth.
(This assumes you’re looking at the daylight side of the Earth.)
The Moon is moving from left to right in the diagram, because it’s between the Earth and the Sun (and remember, it’s behind you!). The Moon always moves in its orbit from West to East in the sky, so that means left to right when it’s at this point in its orbit.
("West to East"? Doesn’t the Moon rise in the East and set in the West? Yes, it does – but that apparent motion is caused by the rotation of the Earth, and not the actual orbital motion of the Moon itself. If the Earth didn’t rotate, you’d sure enough see the Moon move from West to East through the sky – and it would take about two weeks to go from moonrise to moonset! We saw this in diagram 10a.)
If you’re in 3D mode, with "Earth Rotation" turned on, you’ll see the Earth spin at the correct rate, based on the Moon’s distance you’ve set. You’ll see very clearly that the Moon is moving in its orbit faster than the Earth is rotating, because the shadow skirts across the Earth faster than the continents are moving. This makes sense, since the Moon has to cover the entire circumference of its orbit in one month, while the Earth only has to cover its surface circumference in one day. (See below for more detailed calculations.)
Also in this diagram, the label at the right of the slider is the distance the Moon is (along its path of motion) from the center of the Earth, expressed in Earth radii.
You can use your left and right arrow keys at any time to move the shadow along its path. When you do this, you can estimate that things are moving at about the rate of 1 minute or so per keystroke.
Why does the eclipse move from West to East?
We explored this concept in detail in Diagram 10a, but here’s a review:
The Moon rises in the East and sets in the West due to the rotation of the Earth. The eclipse moves from West to East due to the Moon’s movement in its orbit. Because the Moon is moving in its orbit in the same direction as the Earth is rotating, it’s important to know which one is moving faster. If the Earth rotated faster than the Moon moved, then the shdow would indeed move from East to West across the Earth – but this doesn’t happen.
[Note: It can happen, for very rare polar eclipses where the umbra passes “over” a pole and touches the Earth on the anti-Sun side of the pole. That is a very rare and unusual case, but you can model it on this diagram if you want!]
Here are the rough calculations to show that the Moon moves faster in its orbit than the Earth rotates. The Moon’s distance from Earth is an average of about 384,400km. The Earth’s radius is about 6,370km. Now we can calculate:
- The Moon has to move the entire circumference of its orbit, which is 2 × pi × 384400 ≈ 2.4 million km, in 28 days. That’s about 86,000 km per day.
- The Earth’s surface has to move its circumference, which is 2 × pi × 6370 ≈ 40,000 km, in one day.
That means the Moon is moving on average, a bit more than double the speed that the Earth is rotating! This is why, in the overwhelmingly vast majority of cases, eclipses always progress from West to East over the Earth.
Something Extra
This diagram is very sophisticated in what it can show you. By selecting the Day of the Year, and then setting the Moon Position and Rotating the Earth carefully enough, you can model almost any eclipse you’d like. But again, the diagram is an educational tool – not an eclipse calculator! We have omitted a couple of very minor details that would need to be considered in order to predict eclipses to great accuracy. If you want to pursue your study of eclipse calcuations further, the reference materials are out there!
What details did we omit? Well, the Moon actually changes its distance from the Earth during the three hours or so that the eclipse is taking place. That changes the shape of the shadow very slightly. In the diagram, we’ve let you set the Sun and Moon distance, but then they stay constant during the eclipse. You wouldn’t even notice the difference at the scale of this diagram, but we would need to take that changing lunar distance into account in order to produce eclipse predictions accurate to the second.
Also, we haven’t considered that the flat Earth, which is always perpendicular to the Moon’s shadow axis, rotates very slightly during the eclipse due to the Moon’s movement in its orbit. This can introduce very slight changes to the shadow in very special cases which are beyond the scope of the diagram. It’s also the reason why this diagram can’t model an Annular-Total eclipse where the eclipse either begins or ends as total.
Additionally, we have used "generic" values of the actual tilt of the Earth relative to the Sun for the calendar dates. In actuality, these are slightly different depending on the year. Using the exact values is beyond the scope of this diagram, so we’re making do with a very close approximation.
Finally, the Earth isn’t a perfect sphere as we’ve shown it in the diagram. The Earth bulges out slightly at the equator to form what’s called an "oblate spheroid". You’d never notice the difference between that and a perfect sphere at the scale of our drawing, but in real life this slight "flattening" of the Earth is something we have to take into account if we want to draw the shape of the Moon’s shadow on its surface accurately.
Still, the paths are remarkably accurate, considering how much we simplified the math!
What you can learn:
- You can see how the Moon’s shadow has three different parts – the umbra, the penumbra, and the antumbra.
- You can learn the difference between an annular and a total eclipse.
- You can see how the changing distance between the Earth and Moon has such a great impact on the type of eclipse we can see on Earth.
- You can see the basics of how Bessel’s method helps predict eclipses.
- You can visualize the Moon’s shadow moving across the Earth in many different ways.
- You can see what the shadow outline of an eclipse looks like at the middle and the ends of the path.
- You can learn why the eclipse shadow (almost) always moves across the Earth from West to East.
- You can see how much of the Earth’s surface is able to view a partial eclipse, while so little of it gets to see totality.
- You can learn why eclipse paths can take many different forms for different eclipses.

Orbits
Learn about orbital speed, height, and geosynchronous orbits of satellites.
See the instructions for Diagram 25Collapse instructions
Diagram 25:
Orbits
It is impossible to talk about space for very long without considering orbits. So many objects in space orbit around a larger body, it’s difficult to list all the possibilities:
- The Earth and other planets orbit the Sun.
- The Moon orbits the Earth.
- Satellites that control satellite TV, phones and internet orbit the Earth.
- The Hubble Space Telescope and International Space Station orbit the Earth.
- Spaceships are inserted into orbits around bodies they are preparing to land on.
- Double and multiple stars orbit each other.
- All the stars in a galaxy orbit around the galaxy’s center.
In most of these cases, we have one very small object traveling through space in an orbit around a much larger body. This is the case we are going to consider in this diagram.
What’s an orbit?
Everything that is near a very large body (like the Earth) feels the effects of the larger body’s gravity. All the things we see around us are drawn toward the Earth by its gravity, and we see that effect as an object “falling” toward the Earth. Objects will continue to fall until they are stopped suddenly by hitting the Earth’s surface – otherwise, they’d go all the way to the center of the Earth.
But if you throw something horizontally, it will travel a certain distance horizontally as it falls, until it hits the ground at that point. The harder you throw it, the farther it will go away from you until it finally hits the Earth.
But if you could throw it hard enough, it would travel so far horizontally that by the time it fell to where the Earth was supposed to be, the Earth’s curvature would cause there to be no ground to hit! Your object would keep moving horizontally, and the Earth would keep curving away from it, and it would never hit the ground. It would be in “orbit” around the Earth.
This is what orbits are: An object moving so fast (in a direction parallel to the Earth’s surface) that as it falls, the Earth keeps curving away from it so it never hits the ground.
It makes sense that if an object is close to the ground, it has to be travelling REALLY fast for this to happen. It gets easier to maintain an orbit as we go higher up in the sky, because there’s more room for the object to “fall” before it would meet the Earth. There’s also less atmospheric friction in space, so we don’t have to worry about the wind slowing our object down and “decaying” its orbit.
We can calculate the speed we have to throw the object to achieve orbit, based on its height. But there’s more to it than that, because the mass of the Earth also enters the formula. If the Earth weighed more, then it would have a stronger gravity. Objects would fall toward it* faster, and it would have to move faster to maintain its orbit.
*Technically, the object’s “acceleration” would be greater, but we’re trying to stay out of physics class as much as possible!
The radius of the Earth is only important because we want to talk about the height of our object above the Earth’s surface. It doesn’t make much sense to talk about height above the Earth’s center, since we don’t live at the center of the Earth!
The one thing that doesn’t matter in all this? The mass of the satellite itself. That’s right – unless the satellite is massive enough that it’s comparable to the Earth, its mass simply doesn’t make any difference in the formulas! This will happen whenever you have any manmade object orbiting a planet or moon. It will NOT be the case when you have a situation like the Earth and the Moon, or a double star, or a large spaceship and a tiny asteroid, or even the Earth and the Sun. In these cases, both objects have a non-negligible gravitational effect on each other, and the math gets a lot more complicated! These cases are not represented in our diagram.
We’ve also simplified things greatly by making our orbits circular. In real life, this will never be the case, because a perfectly circular orbit is impossible to achieve. We can get very close, so the math is an extremely good approximation – but just as we saw in the diagram on Kepler’s Laws, real orbits will always be ellipses.
We should also mention that, while we’ve drawn the Earth as the main body in this diagram, we could have put any planet, moon or star in its place. You’re able to adjust the Earth in the diagram to a wide range of sizes and masses, and this lets you simulate what would happen if your main object is much larger or smaller than the Earth.
What you're looking at:
The Earth is at the center of the drawing, and we’ve drawn a circle around it that represents the orbit of a smaller body – like a satellite. You can adjust four things in the diagram:
- The radius of the Earth
- The mass of the Earth
- The height of the satellite’s orbit
- The rotational period of the Earth
When you set the first three things, you’ll see the satellite’s orbital speed and period change. That’s because these three things are all you need to know, in order to find out how fast the satellite has to move horizontally in order to stay in orbit. That speed in turn leads to its orbital period – how long it takes to go around the Earth one time.
It seems like there should be more to it than that, but there isn’t. As we said earlier, the mass of the satellite doesn’t enter into the picture.
If it seems like we forgot to discuss the rotational period of the Earth, we’ll get to that in a bit!
Controls:
Planet Mass
You can adjust the mass of the Earth from very little to very big. We’ve put marks where the Sun, Earth, Moon, and a small asteroid would be, to help you get your bearings.
The Reset button puts the slider on the right value for the mass of the Earth.
Planet Radius
You can adjust the size of the Earth, and again we’ve put marks on the slider to show the Sun, Earth, Moon, and a small asteroid. Also, the Reset button sets your radius back to the Earth’s.
Orbit Height
This is the height of your satellite above the surface of the Earth. As you increase the height, you’ll see that the orbital speed gets slower, and the period gets longer.
Calculate geostationary orbit
This control requires some explanation:
Many buildings use a satellite dish to receive TV signals. These dishes can be small or large, but they’re always mounted on the roof or the side of the house, or on a post in the ground. Once mounted and tuned, they never move from their location. They are pointed at the satellite that sends the signal, and this is how the TV gets the data it displays on the screen for you to watch.
How is it that a dish that never moves can stay pointed at a satellite that’s orbiting the Earth? Isn’t the satellite moving through space? It’s certainly not standing still up there!
It is possible to put a satellite at just the correct height in the sky so that its orbital period exactly matches the speed that the Earth rotates. The satellite is certainly moving in its orbit, but the Earth is moving as well! If the speeds of the Earth and the satellite exactly match, then it will look to us like the satellite is standing perfectly still in the sky. This is very convenient, because we can then point our satellite dishes at it and know that we’ll always be able to receive the satellite’s TV signal.
If that satellite were orbiting at a higher or lower altitude above the Earth, then it would appear to drift a bit through the sky, and that wouldn’t work for our purpose. So the companies that maintain those satellites in orbit have to constantly monitor them to make sure they are staying at exactly the right height and speed in their orbits.
A satellite that is orbiting at this height, so that it makes one orbit in exactly the same time as its parent body (the Earth) rotates, is said to be in “geosynchronous” orbit. This word makes sense, because the orbital period of the satellite and the rotational period of the Earth are synchronized.
As it turns out, the only things that matter in calculating the correct height for a satellite to remain geosynchronous are the mass and rotational period of the planet. So when you check the box to calculate the geostationary orbit, the satellite is moved immediately to the correct height based on the settings on the other sliders. You won’t be able to move that height until you uncheck the box.
WARNING: Let’s say you keep the rotational period of the Earth at 24 hours. It is then possible to make the radius of the Earth so large, it overtakes the satellite that is trying to stay in geosynchronous orbit! This will happen if you don’t increase the Earth’s mass to go along with its bigger size. It is impossible to achieve a geosynchronous orbit around a body that has a very low density like this, because the orbit would have to be INSIDE the planet! (How low does the planet’s density have to be for this to happen? About 1/3 the density of balsa wood – so it’s pretty unlikely that we’d have a planet like that, though it IS fun to think about!)
Full disclosure: You can get around all that pretty easily, just by slowing the planet’s rotation down. But that’s not nearly as much fun!
Geosynchronous vs. Geostationary
We used the word “geosynchronous” earlier, but it doesn’t do much good to synchronize the satellite and the Earth if we don’t account for the fact that our satellite dish on the Earth can never move. Many orbits that are geosynchronous would involve the satellite orbiting at an angle to the equator, and this would cause it to appear to us to be moving back and forth along a north-south line in the sky. That wouldn’t do at all. So we use the word “geostationary” to describe a geosynchronous orbit that lies directly above the equator – one in which the satellite never moves to the north or the south as it orbits. This is the only way to be sure that the satellite will never appear to move in our sky on Earth.
[We should also note that for a geosynchronous orbit to lie at an angle to the equator, the orbit has to be elliptical so the satellite’s speed will be slowest at the points of its orbit farthest from the equator. (This is kind of the same thing we talked about with the analemma, where the component of the Sun’s apparent motion in the direction of the equator is greatest when its declination is at the high and low points for the year. This gave rise to the “Obliquity” portion of the Equation of Time, and it’s the reason why our satellite’s speed has to change while it’s orbiting.)]
Since a geostationary satellite must orbit above the equator, and since it must orbit at a given height, an interesting thing will happen for all the people on Earth who have dishes pointed at it. The farther south the dish is located on Earth, the higher up in the sky the satellite will appear to be. This means those dishes will be leaning back, pointing their antennas high up in the sky. Dishes that are at latitudes farther north will be pointed lower in the sky. This effect happens for the same reason the Sun appears to be higher or lower in the sky on any given day for observers at different latitudes – just like we saw way back in diagram 1.
In fact, you could actually calculate the latitude that a satellite dish is mounted at, if you knew the angle its antenna makes with the ground! (You actually have to also know the difference in longitude between the dish and the satellite’s sub-orbital point – but that’s another discussion!)
What you can learn:
- What allows an object to orbit a larger body
- How the mass of the larger body affects the height and speed of an orbiting object
- What geosynchronous and geostationary orbits are, and how they are used
- Why the satellite dish on your house doesn’t ever need to move
Star Magnitudes
How do astronomers describe how bright the stars are?
See the instructions for Diagram 28Collapse instructions
Diagram 28:
Star Magnitudes
What you're looking at:
When the diagram loads, you see two stars. Each of them has its own slider to control how bright it is. We’re showing brightness by the size of the star, as well as a number called “magnitude”. We’re also showing how much brighter one star is than the other, based on the values you select for each one.
Read more about star magnitudes and brightness in the lesson below!
If you click on the button in the upper left (“Absolute Magnitude”), you’ll go to part 2 of the diagram. Here, you have one star, and you can change both its apparent magnitude as well as its distance from Earth. The star on the right of the display will show you what its “Absolute Magnitude” is. Again, you’ll want to read about that in the lesson below.
In this diagram, you can also check the “Sun” checkbox. This will show you the fixed values for distance, absolute and apparent magnitude of our Sun.
Star Magnitudes
If you look at the stars in the sky, it’s pretty obvious that some are brighter than others. Some stars are closer to us than others, and some stars are just simply bigger and brighter than others. The combination of how bright the star actually is, and how far away from us it is, combines to make the brightness that it appears to be to us on Earth.
If you took any star and moved it closer to us, then it would get brighter. If you left any star in place but somehow made it less “luminous” (a measure of its actual brightness), then it would get dimmer. This matches what we experience on Earth with a candle or a flashlight, so it makes sense.
But how should we actually go about measuring the brightness of each star? And how do we communicate those brightnesses so we can compare stars to each other?
Brightness in science is measured in various ways. The amount of light that is present is measured in "lumens", and how bright that light appears when it lights up something is called illuminance. Light intensity is measured in "lux". Luminous intensity is measured in "candelas". And in the English system, we also have a term called a "foot-candle". (Confused yet?) Oh, and by the way, none of these units would be good for describing stars, because they’re all way too big; we don’t see any stars from Earth that are as bright as a candle!
The Common-Sense Approach
Ancient astronomers wanted an easy way to give a simple number to a star, to classify it with a group of similar stars having about the same brightness. Early on, they only had their eyes to try and make these determinations, and it made sense that they would call bright stars “first magnitude”, and dimmer stars “second”, “third”, “fourth” magnitude, and so on. This classification system stuck with us to the present day. Even now, when astronomers can very accurately measure the apparent brightness of a star, we still use this term of “magnitude” to describe a star’s brightness. We’ve also retained the system that a star with a higher number magnitude is dimmer than one with a lower magnitude.
Closer to the present day, a mathematical formula had to be fit to these existing brightness “buckets”, and it was very quickly determined that a normal linear function wouldn’t do. The way that humans perceive relative brightness caused the early classification of stars to fall into what we now call a “logarithmic” scale, and we should describe what that is before we go any further.
There are several things that we experience in our normal lives that cover a very wide range of values. From the very brightest stars to the very dimmest ones you can see, there is a huge range of brightnesses. From the very loudest noises to the the very faintest, again there is an enormous variation in the amount of sound energy that is being produced. And also, from the very faintest rumblings of the Earth to the most violent earthquakes, we need a scale to measure geologic activity that covers a very wide range of values. Each of these three physical characteristics are measured in logarithmic terms.
Logarithms?
To understand logarithms, you have to understand powers. We can take a couple of examples to show you how a logarithmic scale works.
Say you have four examples of things that fall into a category like we listed above, and you have the following values for your examples:
Example 1: value = 10Example 2: value = 100
Example 3: value = 1000
Example 4: value = 10,000
You want to be able to give values for other measurements that fall in between these very nicely, so that you could say that some new example that is 20 falls between your example 1 and example 2 in the same way as 2000 falls between example 3 and example 4. Of course there is a lot more difference between 1000 and 2000 than there is between 10 and 20, but you want to be able to say that relatively speaking, the 2000 value is stronger (or heavier, or louder, or brighter) than the 1000 “in the same way” as the 20 is more than the 10. Logarithms are the answer for this.
What if you changed the scale of your measurements to be powers of 10 instead of the actual values you measured for the examples? Then you could say the following:
Example 1 = 10 = 101, so we’ll call that “1”.Example 2 = 100 = 102, so we’ll call that “2”.
Example 3 = 1000 = 103, so we’ll call that “3”.
Example 4 = 10000 = 104, so we’ll call that “4”.
Now, if another example comes along that has a value of 20 (which is 10 to the power of 1.3), and another example comes along that is 2000 (which is 10 to the power of 3.3), you can see that that extra 0.3 in the powers is the same for both of the new values! We found a way to convey that relationship we wanted, just by using powers of 10! Both of these are somehow “0.3 more than” (or “0.7 less than”) one of the examples we started with.
Earlier, we used the word “logarithm” (or “log” for short) because a log is the mathematical opposite of a power. (It’s technically called an “inverse” function, but we’ll just use the word “opposite”.) If you want to know what power of 10 that the number 20 is, just take the log of 20 on your scientific calculator and you’ll have it. (It is, in fact, pretty close to 1.3)
We’re going to now decide that we will describe our examples by using that log, or power, instead of the actual value. That will mean that if you have something that is a “4” on this scale, and I have a “5”, then yours is 10 times more/less bright, or heavy, or loud, than mine is. We just have to remember that each time we move 1 unit on this scale, we’re really making things 10 times more “whatever”.
And the real beauty of this is that we don’t have to use 10 as the base of the log. We can use any number we want in this system, so long as the result falls into the range of values we want to talk about – like the range of brightnesses of stars in the sky. For our star “magnitudes”, it just so happens that if a value of the fifth root of 100 is chosen for the base, then things fall nicely into place.
What in the world is the fifth root of 100? About two and a half. So, if you are looking at two stars, and one of them is magnitude 3 while the other one is magnitude 4, that means one of them is 2.5 times brighter than the other one. This holds true whether you’re talking about magnitudes 10 and 11, 2 and 3, 0 and -1, etc. The brighter star is 2.5 times as bright as the dimmer star.
But which one is brighter? Remember, the smaller the magnitude, the brighter the star. That fits into the old classification scheme where bright stars were “first” magnitude, and dimmer ones went down from there by being labeled “second” or “third” class, etc. So, magnitude 3 is brighter than 4. A magnitude of 0 is dimmer than -1, and so on.
Using this scale, it now makes sense to talk about magnitudes that go so dim, we can’t see the star. If a star is dimmer than magnitude 6, you’re not going to be able to see it no matter how dark your sky is. With a telescope, you might be able to see 9th, 10th, or 11th magnitude stars. The Hubble Space Telescope can see stars of about 31st magnitude – almost ten thousand million times dimmer than the stars we can just barely see from Earth! (And it’s much easier to talk about numbers like 6 and 31 than numbers like 10 billion!)
Using this scale, we can also talk about magnitudes that are fractional. That means we can say that star A has a magnitude of 2.34, while star B has a magnitude of 2.41. In this case, star B will be just a little dimmer than star A. Once we’ve internalized this system, we don’t really care that B is 7.6% dimmer than A (unless we’re doing an experiment that requires that knowledge). We only care that A is “a little” brighter than B, and that it would be hard to tell just by looking at them.
It also makes sense to talk about magnitude 0 stars, or even ones with a negative magnitude! The brightest star in the sky (called “Sirius”) has a magnitude of -1.46. its nearest rival is Canopus at magnitude -0.74, but Canopus is not visible from most of Europe or the USA, and not at all from Canada.
There are actually only 16 stars brighter than magnitude 1.0, and only 4 that are brighter than magnitude 0.0. (That is, if you don’t count the Sun – which comes in at a whipping -26.7!) If you want to see a great example of a magnitude 0 star (and you’re in the Northern Hemisphere), then you can find the star Vega, which is part of the constellation Lyra the Harp. It’s also part of the “Summer Triangle” – a set of three stars (with Deneb and Altair) that make a very large triangle which is overhead in the evening during the Northern Hemisphere summer. Vega’s magnitude is 0.026 – pretty close to zero!
This logarithmic “magnitude” scale makes it very easy to get a quick picture of how bright a star is, without resorting to the math or physics of luminance. That’s why we use it all the time to talk about how bright the stars are.
And remember earlier when we mentioned earthquakes and sounds? Well, the Decibel scale that we use to talk about the loudness of a sound is logarithmic. The Richter scale that we use to talk about the strength of an earthquake is also logarithmic. Very useful things, these “logarithms”!
Absolute magnitude
If you look up stars in a star catalog, you will usually see two magnitudes listed: “Apparent” magnitude, and “Absolute” magnitude. Apparent magnitude is exactly what it sounds like: it’s a measure of how bright a star appears to be if you’re standing there looking at it. But remember, how bright a star appears to be can be very different than how bright it actually is. There are some stars that are amazingly bright, but they are so far away from us that they look pretty dim to us here on Earth. And there are stars (like our Sun) that look REALLY bright – but if you placed them at the distance most stars are at, they’d appear pretty ordinary. The technical word we need here once again is “luminosity”. A star that has more “luminosity” than another star would be brighter if you placed both stars at the same distance from Earth.
To help compare stars by removing the distance factor from consideration, astronomers invented the term “absolute” magnitude to even the playing field, and tell us how bright a star would be if we somehow managed to move it a set distance away from Earth. That set distance was agreed to be 10 parsecs, or 32.6 light-years.
You can use absolute magnitudes to compare the actual brightness of stars, but you’ll have to look up the values in a table. And remember, if the star is actually closer to us than 32.6 light-years, its absolute magnitude will be dimmer than its apparent magnitude! (That’s because to get the absolute magnitude, we’d have to move the star farther away from Earth than it actually is!) There are quite a few stars in the sky that you can’t even see with the naked eye, that would be as bright as the full Moon if they were moved as close as 10 parsecs away from us. Even famous stars like Betegeuse, Antares and Deneb would become spectacularly bright at that distance. But our Sun? It would shine at magnitude 4.8, which means you’d need a really dark sky to even find it. It would literally vanish into a sea of thousands of other dim, below-average stars. That’s something to think about!
Absolute magnitude is really an academic thing, because there’s no way the stars are all going to magically be able to be placed at a distance of 10 parsecs from Earth. But it is a very good way to compare their relative brightnesses. You just have to remember that the apparent brightness of a star depends heavily on BOTH its actual brightness, and on its distance from Earth.
Oh, and if you’re wondering how astronomers know how bright the stars actually are, there are a lot of ways. It’s well beyond the scope of this lesson to give you all the methods (including spectroscopy, proper motion, main sequence placement, redshift, and so many others), but suffice it to say that if you want to study the stars to see just how accurate scientists can be with all these measurements, there’s a lot of great information out there waiting for you to discover. Maybe you’ll even want to pursue a formal study of astronomy, and help contribute to the next set of great discoveries!
What you can learn:
- You can learn about logarithms, and logarithmic scales.
- You can learn about various things we measure in everyday life that are logarithmic.
- You can see how a star’s luminosity and distance affects how bright it appears from Earth.
- You can learn how a larger number for magnitude means a dimmer star.
- You can learn about the invention astronomers use (“absolute magnitude”) to compare star brightnesses easily.
The Greek Alphabet
Learn the Greek letters! You'll need them in astronomy.
See the instructions for Diagram 27Collapse instructions
Diagram 27:
The Greek Alphabet
It’s important to know the Greek letters, if you want to study Math or Physics – but you’ll also need to know them for Astronomy! We’ll talk about this more in the diagram on Star Designations, but for now we’re giving you an easy way to study the Greek letters.
What you're looking at:
In this diagram, we offer you an easy way to learn the Greek letters. Just slide the banner to whichever letter you want, and a grid will show you the letter. You’ll see each letter displayed in four different but very common fonts. This will help you recognize the differences between standard versions of each letter.
Note that three letters have multiple lower-case forms. For these letters (Theta, Sigma, and Phi), we've shown you both of them.
In case you want to draw the letters, we give you some notes below the grid on things you should look out for. These will help you avoid common mistakes students make when writing the letters.
Quiz Mode
You can also enter Quiz Mode, where we present you with a random offering of upper or lower case letters (your choice), and you name them! This quiz will cycle randomly through the complete alphabet, giving you a chance to see every letter. At the end of the quiz (once you’ve gone through all 24 letters), you’ll see a scoresheet with your results.
Your ultimate goal should be to be able to identify every upper and lower case letter from its picture, to be able to write each upper and lower case letter, and to be able to recite the alphabet from start to finish. When you can do all that, you’ll be able to confidently say that you KNOW the all-important Greek alphabet!
What you can learn:
- The Greek Alphabet!

Star Designations
Learn about how the Greek letters are used to name the stars.
See the instructions for Diagram 26Collapse instructions
Diagram 26:
Star Designations
What you're looking at:
We've given you four constellations (though the Big Dipper is more properly called an "asterism"), and we've labeled the main stars in each one with their Greek letter designations. You can click on any star to see more information about it.
Some background:
By now, you should see why you need to know the Greek Alphabet. If someone is talking to you about α Leo, you’d better know that that Greek letter is a lower-case Alpha! And so on down the line. You need to know the letters in order to read a star atlas! You also need to know the order of the letters in the Greek alphabet, so you know which stars are brighter than others – for example, that Epsilon comes after Delta. In any case, please make sure you know the Greek alphabet, so you won’t be caught off guard and mistakenly pronounce ν Aurigae as a “v” (it’s “nu”) or υ Piscium as a “u” (it’s “upsilon”)!
A bit of linguistics:
And what’s with these words “Leonis”, “Aurigae” and “Piscium”? Aren’t the names of the constellations “Leo”, “Auriga”, and “Pisces”?
Yes they are, but it was decided early on that astronomers would name stars using the Greek letter (or number, or Latin letter, as more catalogs were added) together with the Genitive of the Constellation name. That means that instead of saying “The alpha star of Orion” we would say “Alpha Orionis”. For those of you who have studied Finnish, German, Russian, Basque, Turkish, Latin, Greek, Hungarian, Albanian, Czech, Slovak, Tamil, Arabic, or any other language that uses the Genitive case, you know that it represents the meaning of “having”. (English and the Romance languages [except Romanian] use prepositions instead of case endings to mark possession.) So when we say “Alpha Orionis”, we’re really saying “the Alpha star belonging to Orion”. “Orionis” means “of Orion”, or “belonging to Orion”, and so that’s what was used when the star designations were decided on.
Of course, this means that you have to learn the Genitive of each of the 88 constellation names. (But hey, one constellation [Puppis] is the same in both name and Genitive – so you’re off to a good start with that one!) Please don’t blame us for all this extra work, though: We didn’t invent the system; we’re just telling you how to use it!
(And by the way, you also have to know the abbreviations of the constellation names, so that when you read that the star ε Cnc is part of the “Beehive Cluster” [aka M44], you’ll know to pronuounce it “Epsilon Cancri”.)
In theory, you could look at a table of all the star names with their greek letters, and know their order of brightness. That would be great, but it doesn’t always happen that way. In fact, because of historical reasons, the two brightest stars of Orion and Gemini are not named in order of brightness. That’s right: Alpha Geminorum [Castor] is actually dimmer than Beta Geminorum [Pollux]! (And that’s right – the Genitive of “Gemini” is in fact “Geminorum”. Once again, we’re so sorry – but you’ll get used to it…eventually.)
Finally, you might have noticed that we are always using lower case Greek letters for star names. This is true, but that doesn’t mean you shouldn’t also learn the capital letters. They are used in math and physics – as well as the names of franternities and sororites you’ll see on college campuses. Please visit the diagram showcasing Greek Letters for help learning them.
You can go back to the current diagram and see three other constellations, to show how the Greek letters are used for their stars.
(In an upcoming diagram, we'll show you all the constellations, and give you the opportunity to learn their stars, their abbreviations, and the Genetive forms of their names!)
What you can learn:
- You can learn how the primary designations of the bright stars in every constellation were assigned.
- You see that these designations give you a good idea of the order of brightness of the stars in each constellation.
- You can learn that there are other designations of stars as well - especially the dimmer ones.
- You can learn what the "Genitive" case is, in linguistics.
- You can see all the things you'll need to learn, if you want to know your stars and constellations!
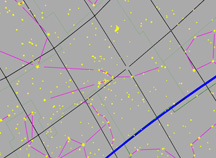
The Constellations
Information about all the constellations in the sky!
See the instructions for Diagram 29Collapse instructions
Summmary
Some instructions for diagram29 in english
Sliders
Lorem ipsum dolor sit amet, consectetur adipiscing elit, sed do eiusmod tempor incididunt

The Flag of Brazil
Learn the states of Brazil, and the stars that correspond to them on the country’s flag.
See the instructions for Diagram 30Collapse instructions
Diagram 30:
The Flag of Brazil
What you're looking at:
You see a banner, a map, and a flag. The banner that runs across the top of the diagram contains the names of all the states and territories of Brazil. These are all synchronized so that you can see the relationships between the states and their respective stars on the flag.
Controls:
You can use your mouse to scroll the banner at the top, and mouse over the names to highlight that state on the map and its star on the flag.
You can also move your mouse over the stars on the flag, or the states on the map. The other elements of the diagram will change to match your selection.
Background:
The flag of Brazil is unique in all the world, in that it displays an ACTUAL star map! Many other countries’ flags show constellations and individual stars, but the specification of Brazil’s flag is such that it defines a complete set of stars and constellations, in a manner consistent with their correct positions in the sky. In fact, each star on the Brazilian flag also represents one of the states of Brazil. The flag’s design specification mandates that if there is ever any change to the list of states, then the flag must be modified to accommodate the change. This has happened 3 times since the flag’s 1889 inception – in 1960, 1968, and 1992.
This diagram shows you the 27 stars that are currently (since 1992) depicted on the flag of Brazil. The first thing you might notice is that the entire star map appears backwards from the way it looks in the sky. (Just look at the depiction of the Southern Cross for proof of this.) This is not a mistake! The designers of the flag chose to chart the stars on the flag as they would appear if you were at an infinite distance away from the Earth, looking down on the stars from “above” them.
There is historical precedent for depicting the stars in this manner. The designers of the flag were copying a very old and respected format for charting the stars on what is known as an “Armillary” sphere, and the flag reflects that history.
Because the Brazilian flag depicts an accurate star map, you will need to be careful if you try to draw it: Each of the stars’ positions is carefully directed by the flag’s legal specification, and even the size of each star must be correct if your drawing is to be accurate.
Brazilians will truly appreciate every effort you make to ensure that you have crafted your version of their flag as closely as possible to the standard. Of course, scientists will too, as there is no question that the careful design of this flag draws the admiration and respect of astronomers the world over!
A special note:
The very small star at the bottom center of the blue area of the flag is Sigma Octantis. This star is very dim, but it is also very special. While the Northern Hemisphere has a bright star situated very close to its pole, there is currently no bright star that can serve as the Southern “Pole” star.
Sigma Octantis is the closest star to the South Celestial Pole that is visible – though you need a dark sky to see it! Still, because Sigma Octantis occupies that special place in the sky, Brazilians chose it to represent the Federal District which contains their country’s capital Brasília. The “Pole star” – the foundation of the Southern sky – therefore represents the seat of government for the great country of Brazil!
What you can learn:
- You can learn how the flag of Brazil contains stars that match up with each state.
- You can learn the locations and names of the states within the country of Brazil.
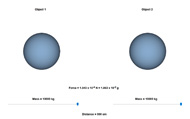
The Force of Gravity
Learn about the gravitational force between two objects.
See the instructions for Diagram 31Collapse instructions
Diagram 31:
The Force of Gravity
This diagram shows you three scenarios that can help you learn more about the force of gravity.
Gravity is a force that acts between all objects in the universe. It is the force that holds us to the Earth, and causes things to drop to the ground when you let go of them. Although we think of gravity as being VERY strong, it is actually one of the weaker forces in nature. Objects must be VERY massive in order for their gravity to have much of an effect on other objects.
In this diagram, we are going to be concerned only with the force that exists between two objects. Of course, if you have more than two objects, they will all pull on each other. In this case, things get very complicated in a hurry, so we’re going to stick to a two-object system. (In fact, if you have three or more bodies involved, it’s usually necessary to resort to extremely complicated calculations, or even a computer simulation, to figure out how things will move around and attract each other.)
We are going to put some numbers into an equation, and see what happens to the “force” that comes out of that equation. The force that we calculate is the whole point of this diagram. It is a number that tells us how strongly our two objects are pulling on each other. If the force is strong enough, the two objects will actually pull so hard on each other that they will move together, orbit around each other, or even stick together. This is the case when you drop something; the Earth pulls on it and it falls to the ground. What is actually happening is that the Earth and the thing you dropped are coming together in space. The distance that each one of the objects travels in order to meet the other one is based on the relative size of each object. That means that the small object that left your hand moves a lot more than the Earth does! We perceive that action as “falling”.
In the same way, you can feel this force from the Earth pulling on you while you’re just standing still. You feel the force as weight, and the only reason you don’t fall all the way to the center of the Earth is that there is a floor, or the ground, that is stopping you!
We will only throw one formula at you, but we need to do that because it is SO important. Here it is:
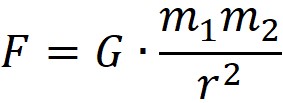
Let’s break this formula down a bit:
F is the force we’re trying calculate. It is the “amount of pull” that exists between the two objects.
The masses of our two objects are m1 and m2. If you haven’t studied physics yet, you can imagine that mass and weight are kind of the same thing. They certainly aren’t in reality, but for the purpose of this exercise, we can imagine that they are. What mass is, is the amount of “matter” that is contained in an object. So a balloon isn’t very massive because it’s filled with really light stuff: air or helium, for example. A block of lead the same size as that balloon will be much more massive. Something the size of the Earth is really massive, and the Sun is even more massive than that. This concept will get us where we need to be with our understanding of gravity.
The distance between our two objects is r. Why do we use “r” for distance? Well, it is very convenient in physics at times to visualize a circle or a sphere with one object at the center and the other object at the endpoint of a radius of that sphere. It makes the math work out better, and so it’s just the way things are done. In this case, “r” means “radius”. If you want to call it “d”, that’s fine – but the formula is usually given with an r instead.
G is a very special number. It is called the “Gravitational Constant”, and that’s just what it is: a constant that has been measured very accurately, and is very stable over distances and time. In other words, we think that G is constant now, and that it always has been and always will be. We don’t know that for a fact, but within the scope of our experiments in class, we can assume that it is. We also have no reason to believe that G isn’t constant everywhere in the universe.
(If you care, G is equal to 6.67408 × 10⁻¹¹ m3 kg-1 s-2. But we said we were only going to give you one formula, and that looks WAY too much like another one. So let’s not worry about it for now!)
Back to the Gravitational Force formula. Let’s remember what it looks like:
If we read this formula in English, what it says is:
“The gravitational force between two objects is proportional to their masses, and inversely proportional to the square of the distance between them.”
Hmm. That still sounds too much like math. In simpler English, it’s like this:
“The more massive two objects are, the bigger the gravitational force between them. And the closer together the two objects are, the bigger the gravitational force between them. And the distance is a lot more important than the masses.”
This means that we will see a bigger increase in our force if we move the objects twice as close together, than we would if we make one of them twice as massive. If we make BOTH of them twice as massive, and then double the distance between them, the force will stay the same. But in order to keep it the same, we only did one thing with the distance (we moved the objects farther apart) – whereas we had to double BOTH of their masses to balance that out. That’s why the distance ends up being more important.
What you're looking at:
Let’s get to the diagram now. There are three modes you can choose from, and here is a brief description of each one:
Large objects:
Here, we are using three very large objects (the Sun, the Moon and the Earth), and showing the forces between them. These objects are so large that the huge distances between them are overwhelmed by their masses. That means the gravitational forces between them are huge, and that’s why they can stay in orbit around each other!
Small objects:
Here, we have two objects that are much, much smaller than planets and stars. These objects are of a typical size that you might find lying around near you, and we’ll let you play with their masses and distances in order to calculate the (tiny) gravitational forces between them.
Relative Force:
When you study Gravity in physics class, you’ll usually be asked about what happens to the force when you move things farther apart or closer together, or when you change their masses. This mode gives you an easy way to see why those problems aren’t nearly as hard as you think!
Now let’s look at some detailed descriptions of the three modes in the diagram:
Large objects:
There are only three situations you can look at in this picture. You can select the Earth-Sun system, the Earth-Moon system, or the Sun-Moon system. In each case, you’ll see that the forces between the two huge objects is very huge itself. We’ve put the numbers in scientific notation, so you’ll need to understand that number system in order to read and compare the numbers. But trust us – the forces are VERY large!
One fact is very interesting to note. First, select the Earth-Moon system, and note how thick the arrow that connects them is. Now, select the Sun-Moon system and compare its arrow. You’ll see that the force of gravity between the Sun and Moon is greater than the force between Earth and Moon. That’s right – the Sun pulls on the Moon harder than the Earth does! Astronomers like to say that the Moon actually revolves around the Sun, and all the Earth does is make it wobble around while it orbits. This fact is the reason they can say that!
Small objects:
Here, you have much more control over the objects in the diagram. You have two objects whose masses can vary from 1kg (about a quart/liter of water, a pineapple, or an average bunch of bananas) to 10,000 kg (an armored car, two small helicopters, or about half of a large bus). The distance between the objects can be set from 1cm (about half an inch) to 10m (The highest olympic diving platform).
These settings let you experiment with normal, everyday objects at normal, everyday distances. What you’ll see immediately is that the force of gravity at these scales is VERY small. Two average-sized people, for instance, would have to be about 1cm apart – that’s less than an inch – for the force between them to even amount to the weight of half a paper clip! And remember, we’re talking about the centers of the two people being that close – so it isn’t even physically possible to set up the situation!
In fact, you’ll find that if you want a gravitational force that’s even as much as the weight of a pen cap, it’s almost impossible to set things up so that you could physically get two large objects close enough. This is why we don’t experience gravity acting between everyday objects in our everyday experience.
(We also need to note here that we’re converting the force – which is calculated in a unit called “Newtons” – into grams or kilograms by assuming we’re at the surface of the Earth. This is as correct as we need to be, in order to get the concept across to you. It’s a physics thing that we’ll let you discover when you study physics in school!)
Relative Force:
It is very common whenever we’re learning about gravitational force for the teacher to give you a question like this (especially on a test!):
“Suppose you have two objects. You triple the distance between them. Then, you make one of them four times as massive as it was, and make the other one-half as massive as it was. What is the net effect on the gravitational force between the two objects?”
This problem seems very complicated until we remember the formula. If masses change, then the force will change right along with them. That means that if you’ve quadrupled one mass, and cut the other mass in half, then the change in your gravitational force is 4*(1/2) – meaning you’ve effectively doubled it. Then, you realize that by tripling the distance, your new force has fallen by the square of 3, which is 9. So we take our “doubled” force and divide it by 9, to get a new final gravitational force that is 2/9 as much as it was before.
It’s the change in one mass, times the change in the other mass, divided by the square of the change of the distance – just like the formula says! (And if you’re wondering about the Gs in the formula, that number is a constant; it doesn’t change! That means it doesn’t affect the change in the force.)
In the diagram, you can adjust the sliders however you like, and the changes in the numbers will be shown in the formula as well as reflected in the final answer that is displayed for you.
Best of luck on your test!
Something Extra:
You can see from the formula for Gravitational Force, that this force between two objects becomes smaller by a factor of the square of any increase in distance, and also larger by this same factor if the distance decreases. In physics, this rule is known as an “Inverse-Square” law. This situation rightfully deserves its own name because there are many other situations in physics that also obey an inverse-square law. The amount of energy received from a light source obeys an inverse-square law. So does radar energy, the attraction between charged particles, and the amount of sound pressure in acoustics. These are only a few examples of where this “inverse-square” law applies. It is very important in physics, and especially so with a concept as fundamental as the Force of Gravity.
What you can learn:
- Many quantities in physics, including the gravitational force, obey the Inverse square law.
- The classical gravitational force is based ONLY on the objects’ masses and distance between them.
- The gravitational constant is thought to be universal across space and time.
- Distance is very important, but large masses make a difference too!
- The gravitational force is really only applicable at the scale of huge bodies in the solar system or the universe.
- The gravitational force depends on the distance between the centers of the bodies involved. (This will be very important in your Physics class!)
- Gravity acting between three or more bodies is much more complicated than a simple model can show.
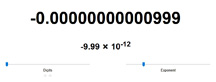
Scientific Notation
Learn about this important way of writing numbers in science.
See the instructions for Diagram 32Collapse instructions
Diagram 32:
Scientific Notation
In astronomy, we use very large numbers all the time. Speeds, distances, orbits, masses – they’re all big. In fact, they’re “astronomically” big! And when astronomy joins with other sciences, such as physics and chemistry, we find that we need to use really small numbers as well. Wavelengths of light, microgravity around small asteroids, atoms and molecules that make up all the things in the universe – they’re all described by numbers that can be very small.
Numbers can have lots of zeros
45,000,000,000? 0.000000364? Scientists have found that it’s very tedious to write big and small numbers all the time, so they’ve come up with a way to avoid writing all those zeros. We use their method in many of our diagrams, so we need to explain what you’re looking at when you see it in action.
Why not just use names?
Large and small numbers can be written as powers of ten, and it’s pretty simple to understand what those are. Let’s say you have a number like 1 billion: 1,000,000,000. That’s a lot of zeros, and so we’d be tempted to just leave the number written out in words. But it’s not necessarily the case that the word “billion” even means the same thing in every country. What one country calls a billion, another country might call a trillion, and that means we can’t simply use the name of the number.
Some countries also use their own names for large numbers, which don’t really translate well; “Lakh” (100,000) and “Crore” (10,000,000) are used a lot in South Asia, but most westerners have never even heard of them.
Plus, names can be very deceiving. You may have noticed that all those millions, billions and trillions kind of run together in your head. But there’s a huge difference between them – for example, a million seconds is about 12 days. A billion seconds is about 31 years. And a trillion seconds is 31,700 years. Quite a difference! That means we need a more precise way to describe big numbers, if we want to do any calculations with them.
The number “1 billion” (in English) is written as the number 1 followed by nine zeros. One thousand is a 1 with three zeros, and a million is a 1 with six zeros. Wouldn’t it be nice if we had a way not to have to write all those zeros? Maybe if we could just say how many zeros there were in a number, that’d be good enough? Then it would be understood that, every time we increased that count by one, say from 15 to 16 zeros, it means we added another zero to the number. That’s the same as multiplying it by 10. And if we had that special notation, we could use it to easily talk about a 1 with a hundred zeros behind it. That would be more convenient than writing out 100 zeros and expecting somebody to count them all accurately. (“Oops, you only made it to 99 – you’re off by a factor of ten!”) That difference might be important.
Scientific Notation
Fortunately, such a system exists, and it’s called Scientific Notation. In scientific notation, we use powers of ten. It’s nothing more than simply describing how many zeros there are in the number we’re talking about. So if you have 1,000, it’s got three zeros. We will call that 103, and in fact, 103 actually is 1,000. It’s a 1 with three zeros behind it.
So if 103 is one thousand, what would a million (1,000,000) be? Well, a million has six zeros behind it, so it would be 106. A billion would be 109. A trillion would be 1012, and so on. We manage to avoid writing all these zeros by simply saying 1012. It’s a nice compact notation, and it works very well.
Now, every number you can imagine doesn’t always have a 1 with a bunch of zeros behind it. You might have to talk about 2 trillion, for instance. In that case you can say 2×10¹², because it’s just 2 times whatever 1012 was. It used to be a 1 with 12 zeros, and so two of them will now be a 2 with 12 zeros.
Rounding numbers off
What about the number “two trillion, 500 billion” (2,500,000,000,000)? That’s got a 2 and a 5 in it, and so now we have to think a bit more mathematically. What we really have is a 25 with eleven zeros after it, so we could say 25×1011, and that would be good enough. But scientists have reasoned that if you did that, and then you had a number like 2,543,824,130,000, then you’d have to still write out a whole lot of digits just to say 254,382,413×104. That “simplification” didn’t do us much good! And all those smaller digits may not be important in the measurement or the experiment that you were doing. So, scientists have come to an agreement: Whenever we have a number times 10 to a power, we’re going to force that number to fall in between 1 and 10 – and we can’t use exactly 10. We can use “9.99999999…”, but not “10”. In scientific notation, we can only have one digit to the left of the decimal in our number part.
That does two things – it prevents us from having to write long numbers times 10 to a small power, and we can then show or round off all those numbers after the decimal, depending on what it is that we want to do. Even though those numbers might represent large quantities, in the general scheme of the overall number itself, they don’t represent as much as that first digit. We can include them if we want, or we can round off if it suits our purpose. So if one person has 2.54382413, and somebody else says it’s about 2.5, that might be good enough. If we say 2.5×10¹² vs 2.456838×10¹², we’re still pretty much in the same ball park.
In the above example, where we used to be stuck with 254,382,413×104, we’re now able to say 2.54382413×10¹², or round it off to 2.5×10¹². It’s our choice.
Just move the decimal!
Here’s another example: 13,400. It’s “134”, then “00”, so that means 134×102. To follow our rule, we have to take that 134 and turn it into a number between 1 and 10 – and all we’re allowed to do is move the decimal point. So let’s make it 1.34. That qualifies, because it’s a number between 1 and 10. To do this, we had to change 134 into 1.34, which is moving the decimal point two places. (Remember, 134 has an implied decimal point after the 4.) Since we moved the decimal point two places, and made the 134 smaller, we have to compensate by making the power of ten bigger. So our original 134×102 has become 1.34×10⁴, and that is proper scientific notation. It’s also exactly what 13,400 is: 1.34 “ten thousands” (since 10,000 is 104).
If we were to round it off, that number becomes 1×10⁴: a “1” with four zeros after it. But those zeros aren’t really zeros any more – they’re places held by other numbers. But the notation accomplishes the same thing as if they were zeros. The four places after the “1” are still four valid places, and so “four” becomes the power we can use on the 10. That’s what’s important to the scientific notation mindset.
Other powers
Now what about small numbers? We can do exactly the same thing, except this time our really small numbers aren’t going to have zeros after them – they’re going to have the zeros in front of them. Let’s take a simple example: 0.005, which is written out as “five thousandths”:
The number part of this decimal is going to become a 5 in scientific notation, but we have to figure out what power of ten to put on it. That decimal point after the 5 had to be moved three places to the left to come up with 0.005. So once again we’re going to balance things out by saying that however many places to the left we had to move the decimal point, that’s going to be the power of ten that we use. But we can’t use 3, because 5×10³ would be 5 thousand. The number we have is 5 thousandths. We realize that since we moved the decimal point to the left, we have to use a negative power: Our power of ten will be 10-3. This in general is always going to be the case: If you start with a number that’s bigger than 1, your power of ten will be positive. If your number is smaller than 1, the power of ten will be negative.
Another example – how about good old 1/2, which is 0.5? Again, this number uses a 5, and we had to get to 0.5 by moving the decimal point one place to the left. So the power of ten in this case must be -1. In fact, when you study Algebra you’ll learn that 10-1 is in fact 1/10. So 5×10⁻¹ is exactly what it says it is: five “tenths”. And that is 0.5, just like we wanted.
We’ve seen positive powers and negative powers; what about using 0 as a power? Well, when you study exponents, you’ll see that 100 is a valid number – it’s just 1. So if we have a number like 6.7, which is already between 1 and 10, then scientific notation doesn’t do anything to it. We don’t have to move the decimal point at all – or to put it another way, we have to move it zero places. So, we can write our number as 6.7×100. This is in fact 6.7×1, which is 6.7. Pretty simple.
[Let’s also note: Even though fractional powers of 10 are allowed in math, we’re not going to use them in scientific notation.]
In the diagram, you have a way to control both the number part and the power-of-ten part of your scientific notation. We’ve limited you to powers of ten that go from -18 to +20, because we want to show you the number written out in full, and that’s all the room we had on the screen. Scientific notation in fact can have powers of ten much larger than 20 and much smaller than -18. In fact, it can go as big or as small as you want. Once you get to a certain point, though, the numbers lose physical meaning. There are “only” about 1080 atoms in the universe, according to the latest theory, so it’s hard to imagine what you might be modeling if you use larger powers than that. (But isn’t that a great justification for using scientific notation in the first place?!) You can certainly use larger powers, but you’ll have to have a good explanation as to what you’re describing.
Something extra
We should stop here for a quick aside, to tell you there are numbers in mathematics (especially number theory) that are much larger than what standard scientific notation can show. How can this be? If you tried to write out the number of atoms in the universe, you’d have to write out a number with about 80 zeros. Long enough, but certainly possible. What if you wanted to have a number that had as many zeros in it as there are atoms in the universe? You couldn’t write that in scientific notation, because you wouldn’t have enough paper or ink (or time) to write the astronomical power of ten you’d need. Mathematicians have devised other number systems that they use to talk about truly gargantuan numbers like these. Many times, mathematicians aren’t dealing with objects that exist in the physical world. That means they have no limits as to the size of the numbers they can use in their proofs, or whatever else it might be that mathematicians think about.
Back to Scientific Notation
We’ve given you two sliders. As you move the sliders, you’ll see the big number change accordingly. Below it, you’ll also see its corresponding scientific notation representation change. You’re controlling the scientific notation, and the big number is following right along. You can create any number you want in this range (so long as it has no more than three significant figures) by setting the sliders wherever you want them.
You also have a checkbox that says "Engineering Notation". What is that? Well, if you’ve studied the metric system, you know there are prefixes that we can put on any unit. These prefixes start out simple enough, with ones for 10, 100, 1/10, 1/100. But then we have them for 1,000 and 1/1000, 1,000,000 and 1/1000000, and so on. When you count the numbers of zeros that these prefixes represent, you always go from one to the next by changing the number of zeros by three. The prefixes are defined out a long way in both directions, but they always represent numbers that jump by three zeros each time.
We almost always want to use these prefixes; we don’t want to say 1×10⁻⁶ meters, but rather 1 micrometer (μm). We want to say 1 gigawatt (GW), millikelvin (mK), kilofoot (kft), or teradollar (T$) – and we want to use the prefixes rather than powers of ten. These powers of ten are all multiples of three, so we don’t want to be stuck with a number like 1×10⁴. There’s no metric prefix for 104, but there is one for 103. So instead of saying 1×10⁴, we’d rather say 10×103 so we can use a metric prefix. (We did that conversion by seeing that we increased the number part from 1 to 10, so we balanced that by reducing the power of ten from 4 to 3). Now we can say kilo-whatevers! This example might be 1×10⁴ watts, but we can now simply say 10 kilowatts. Forcing us into using scientific notation using powers of ten that are multiples of three (so we can use an appropriate metric prefix) is called Engineering Notation. The power of ten we need to use is the multiple of three equal to or smaller than the regular power of ten would be in standard scientific notation. The rule of having to have our number part lie between 1 and 10 is now thrown away, so we can gain the benefit of using a metric prefix. (The number still has to be between 1 and 1,000 though!)
So if we had 108, we’d take that down to 106 so we can use the “Mega-” prefix. 10-2 would end up being 10-3, or “milli-”. 10-7 would go to 10-9, or “nano-”.
What you can learn:
- You can learn what “powers of ten” are
- You can see why very large and small numbers have ways to be written that prevent you from having to write lots of zeros.
- You can learn how to convert between numbers using different powers of ten.
- You can get an introduction to using negative numbers - and even zero - as a power.
- You can learn there is a variant of scientific notation called Engineering Notation, which enables you to use standard metric prefixes.
- You can learn that there are systems of writing numbers that are too large or small even for scientific notation
